Now that we have a Prometheus instance monitoring all our Prometheus exporter nodes, we can look at a way to display the data in a more easy-to-understand way. Enter Grafana, one of the best data visualisation dashboards around. We are going to install it as a separate LXC container as well, just like we did with the Prometheus Monitor node. Remember, Prometheus is the node monitoring all our exporter nodes and all the data is stored on it as well. Grafana is just a way to visualise that data in an easier way, so we don't need a very beefy node for Grafana.
Step 1: Install a new Grafana LXC
We are going to use our good old helper-scripts.com again to install a new Grafana instance. Go to the site and search for Grafana, there should only be one option.
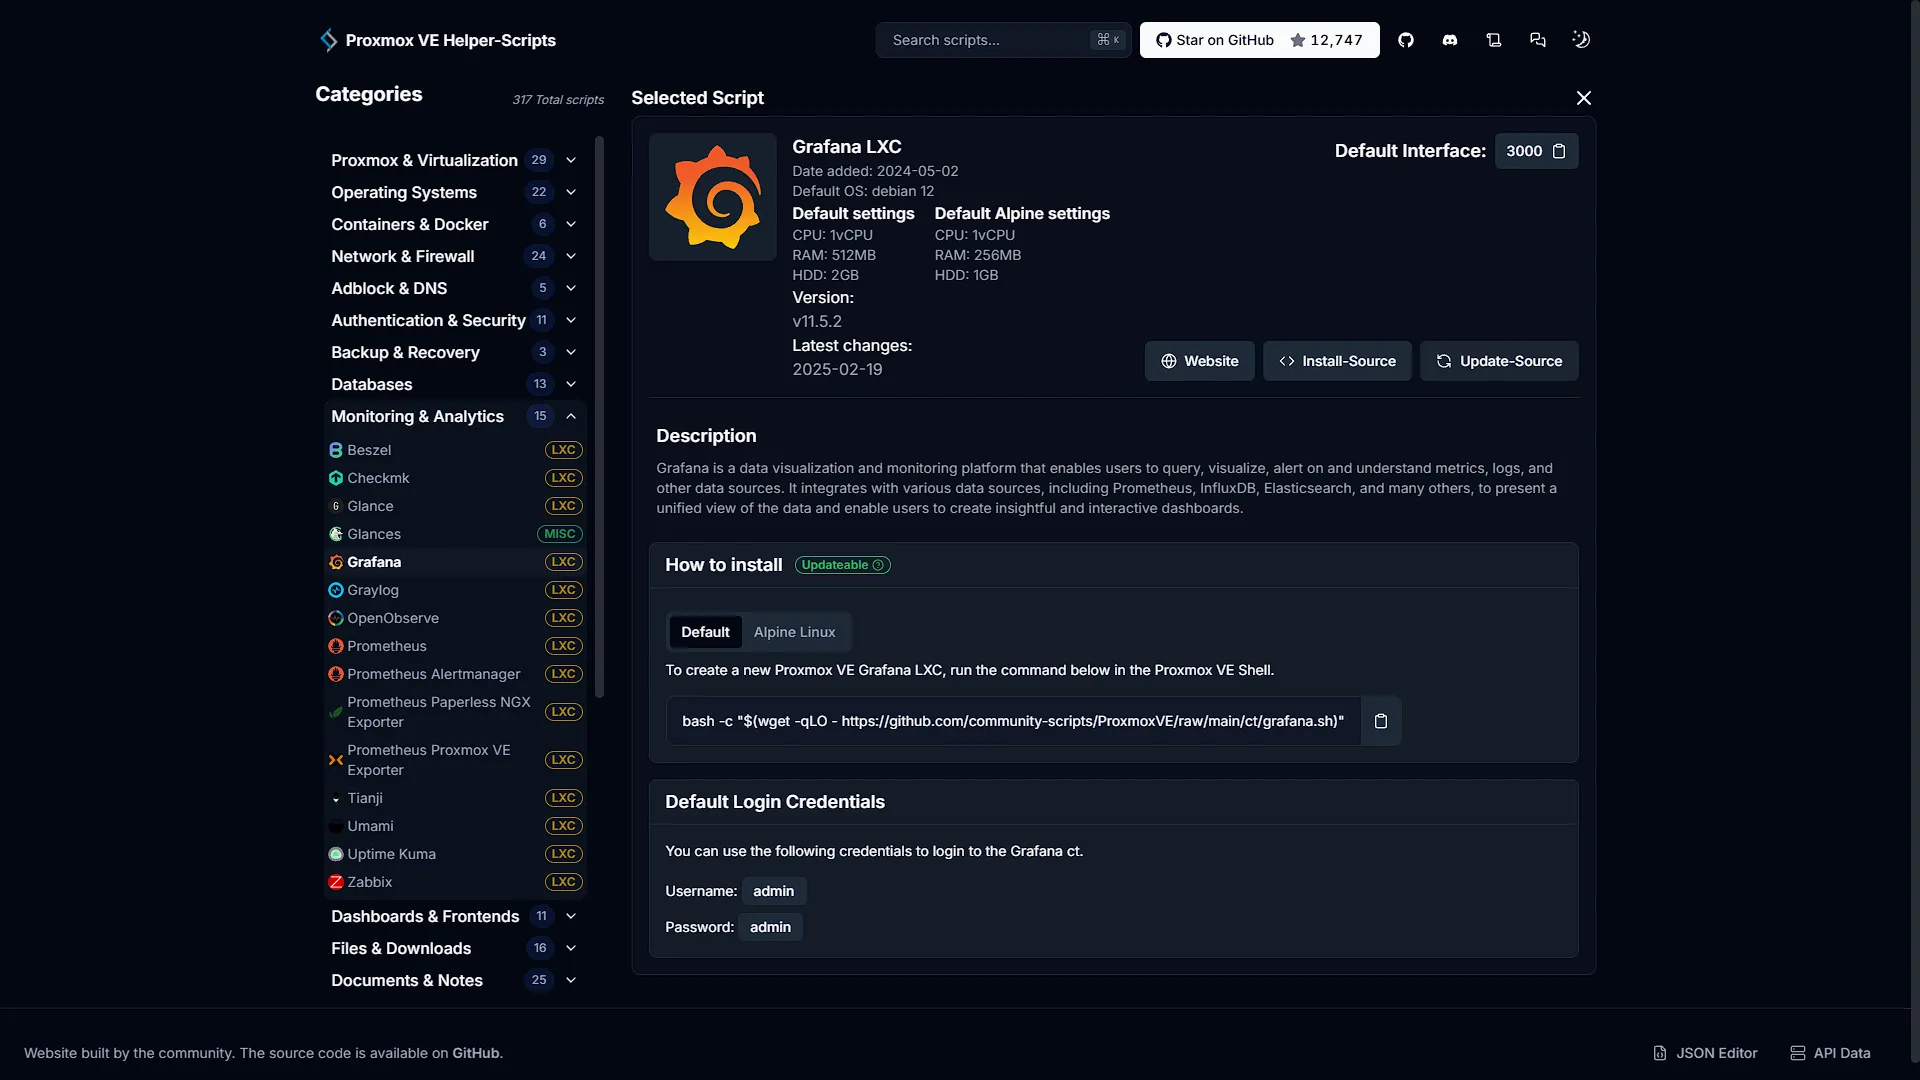
You will see there are two options in this case, one with the default container options, and one for Alpine Linux. Alpine is an extremely lightweight Linux distro, so you can choose either one. The difference in resource usage is:
| Default Install (Debian) | Lightweight Install (Alpine) |
| CPU: 1vCPU RAM: 512MB HDD: 2GB | CPU: 1vCPU RAM: 256MB HDD: 1GB |
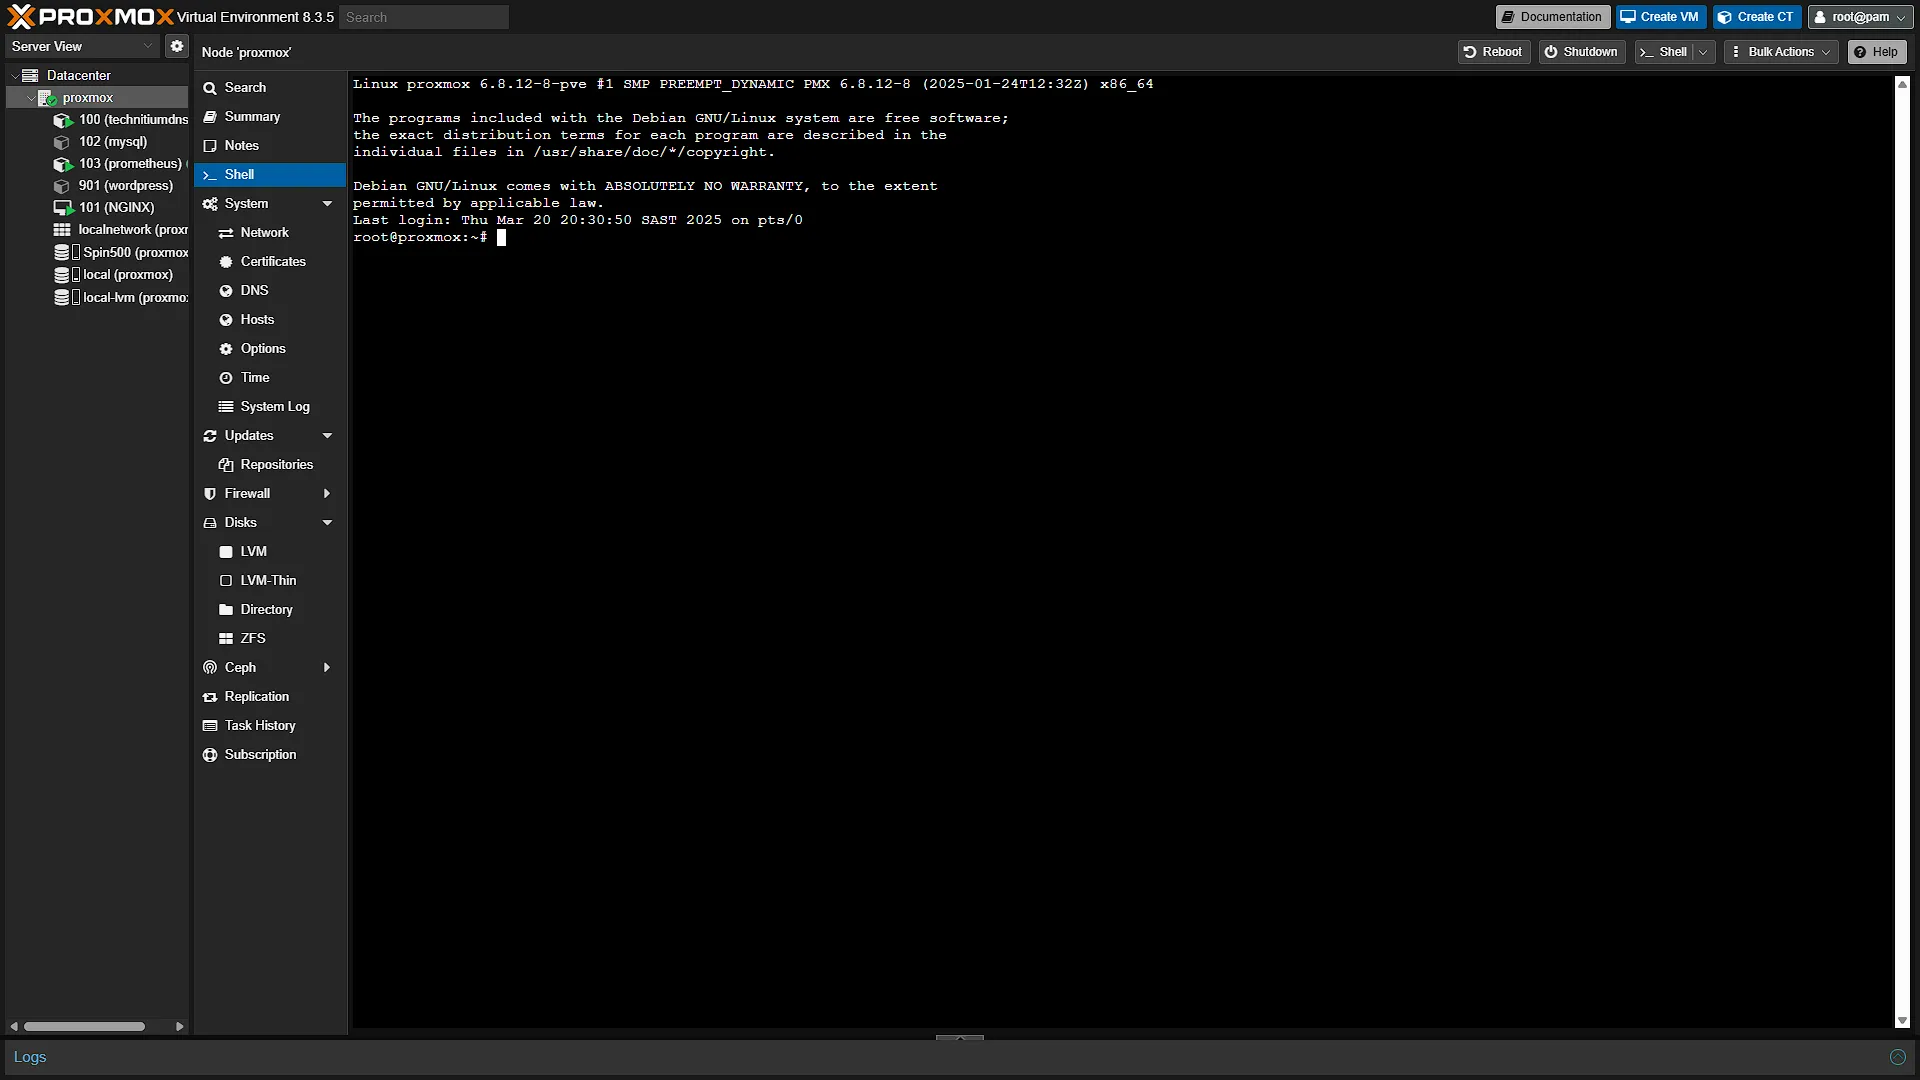
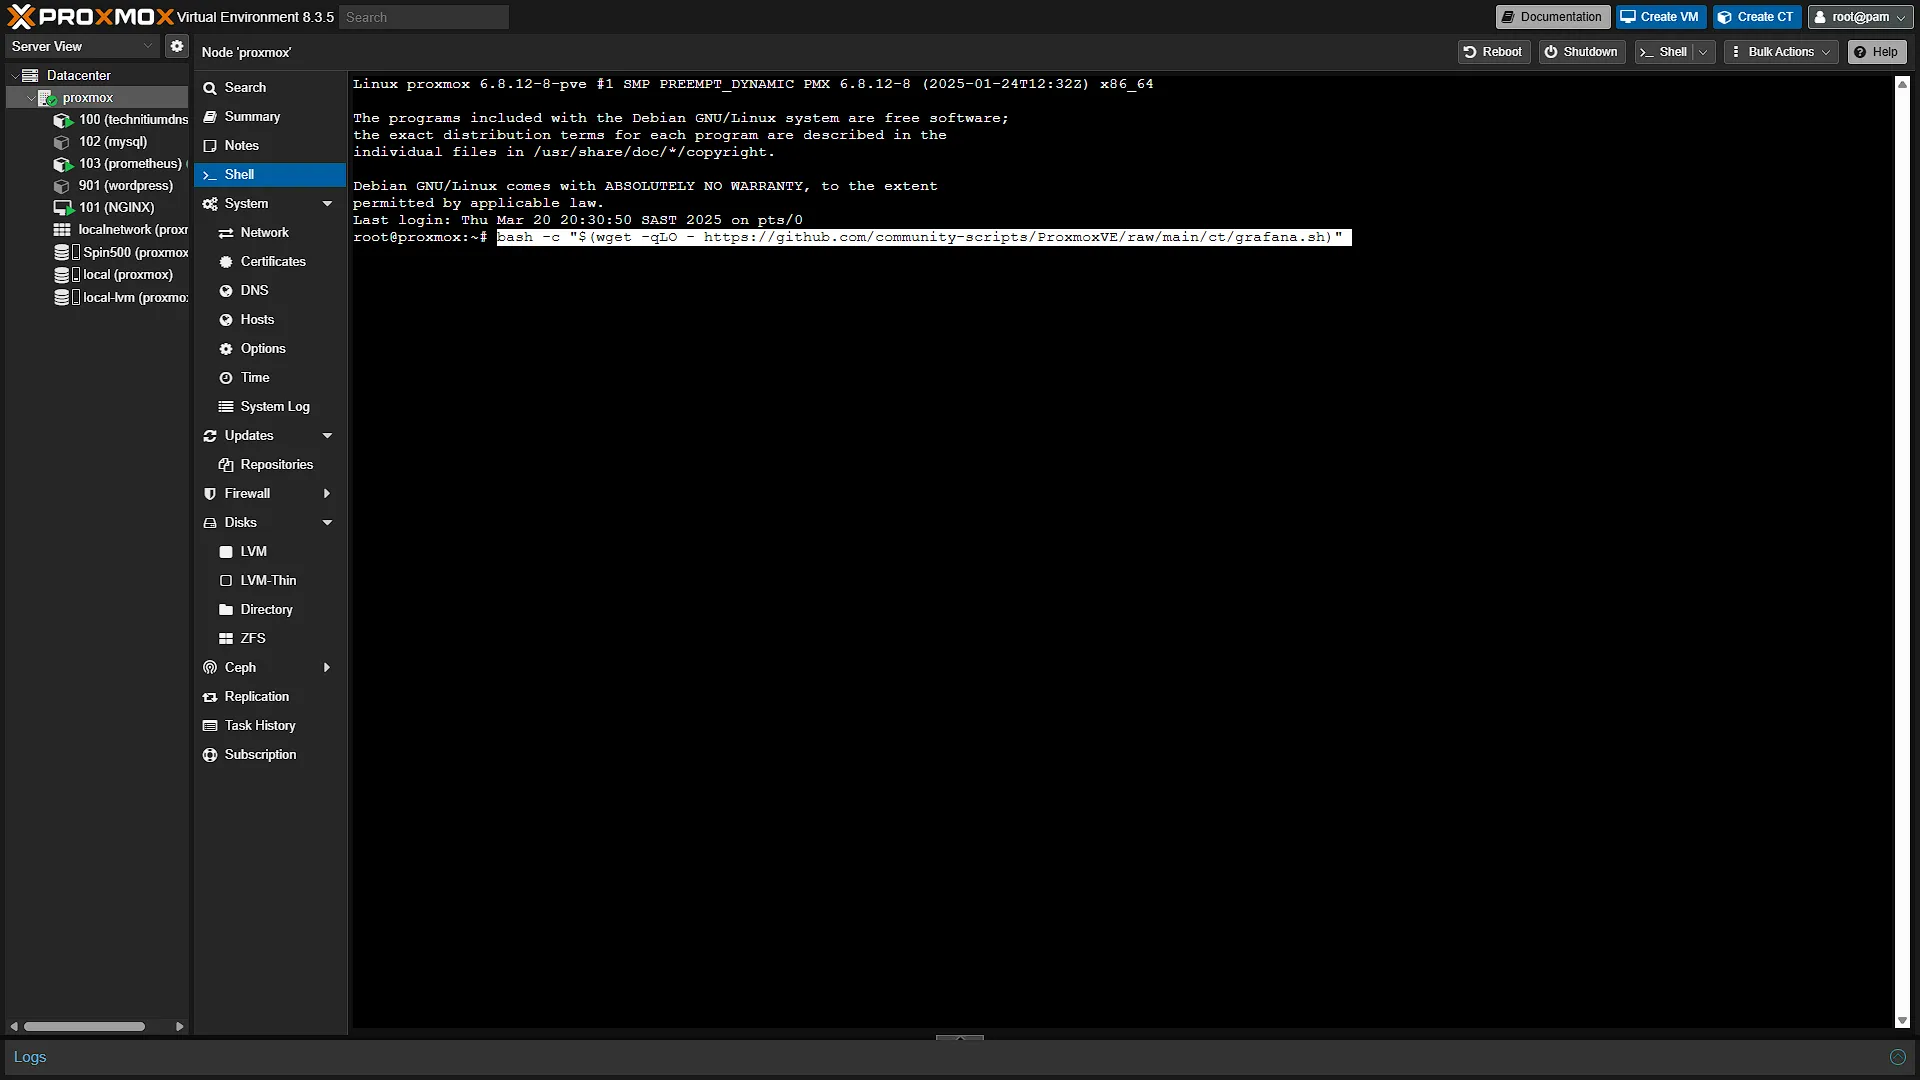
Whichever one you choose, log into your Proxmox instance. In the left navigation pane, expand Datacenter and select the Proxmox node you wish to install Grafana on. If you are following along with our Build your own Homelab series, the Proxmox node should be called proxmox. In the middle navigation pane, select  to open a new shell window. Paste the command of the install you choose and press
 Enter. The install will start.
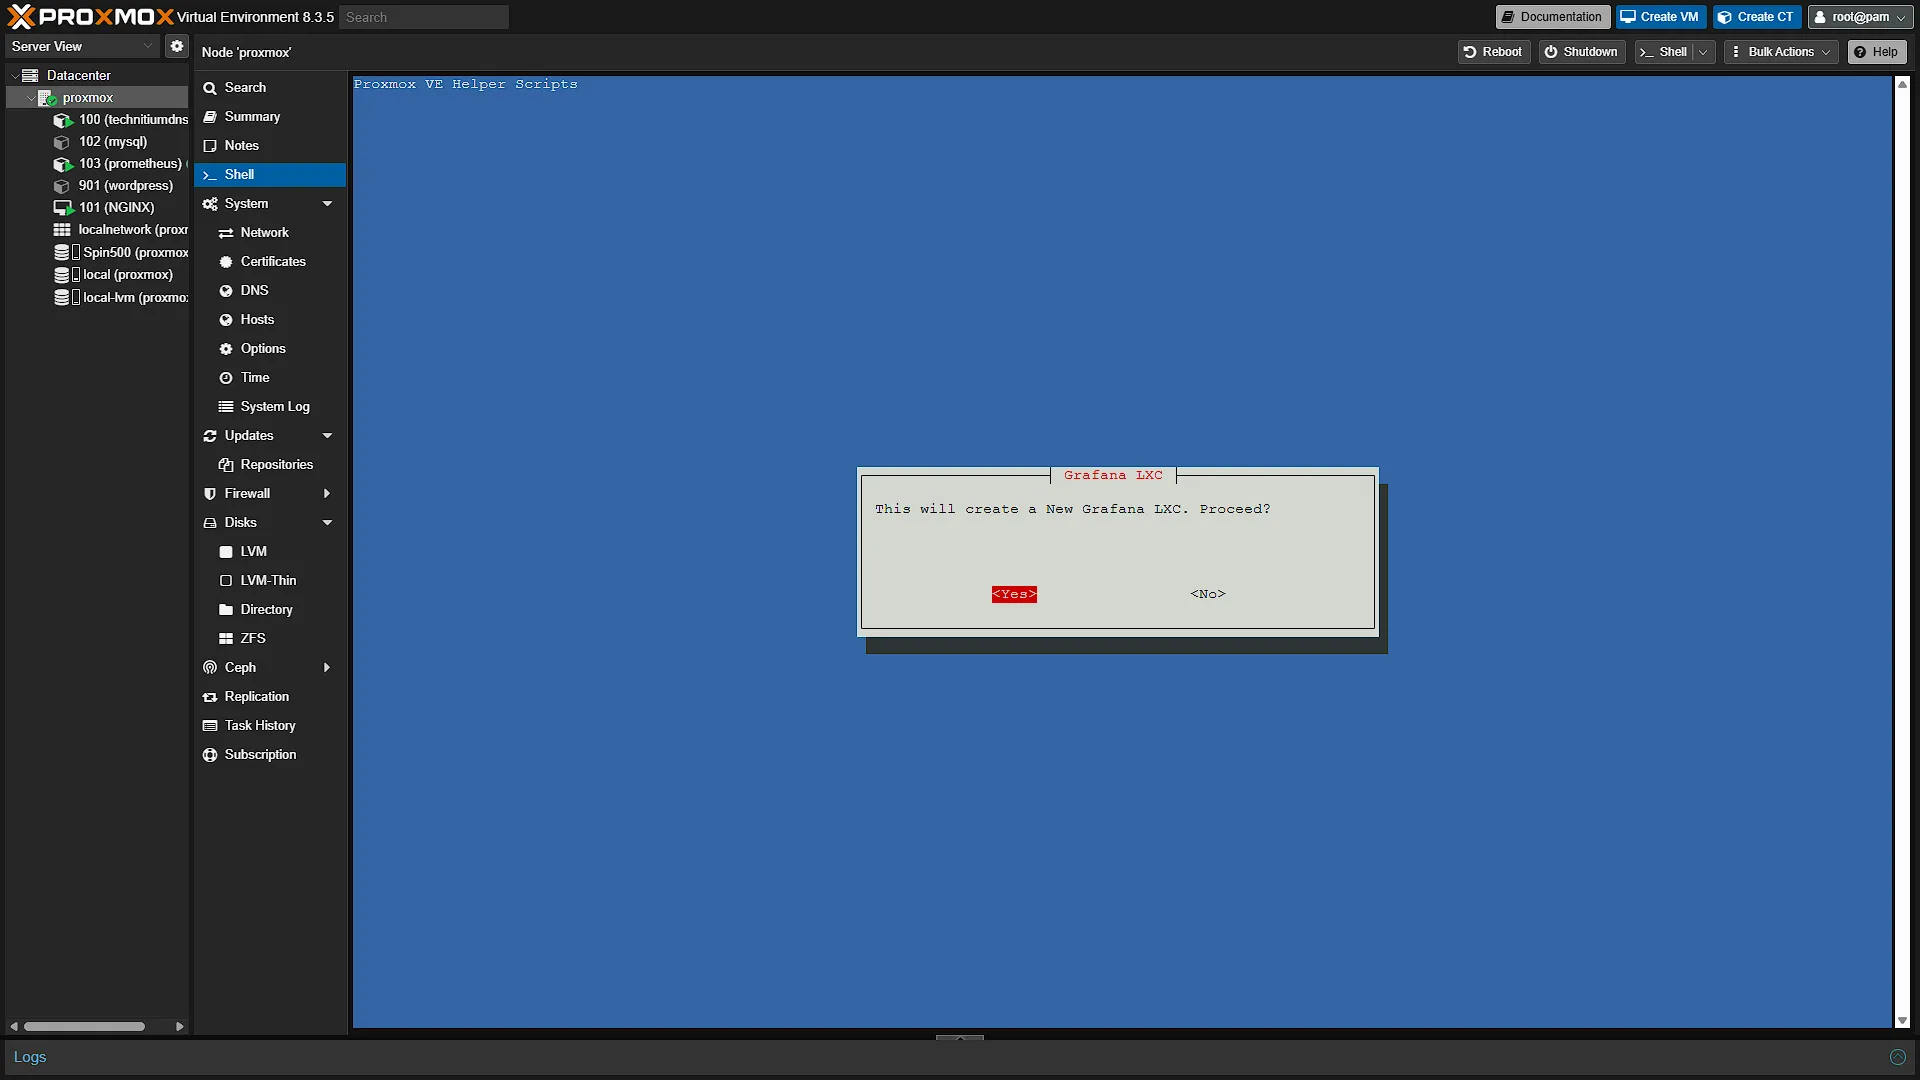
The first screen will be a confirmation, explaining that we are going to install a new Grafana LXC container.
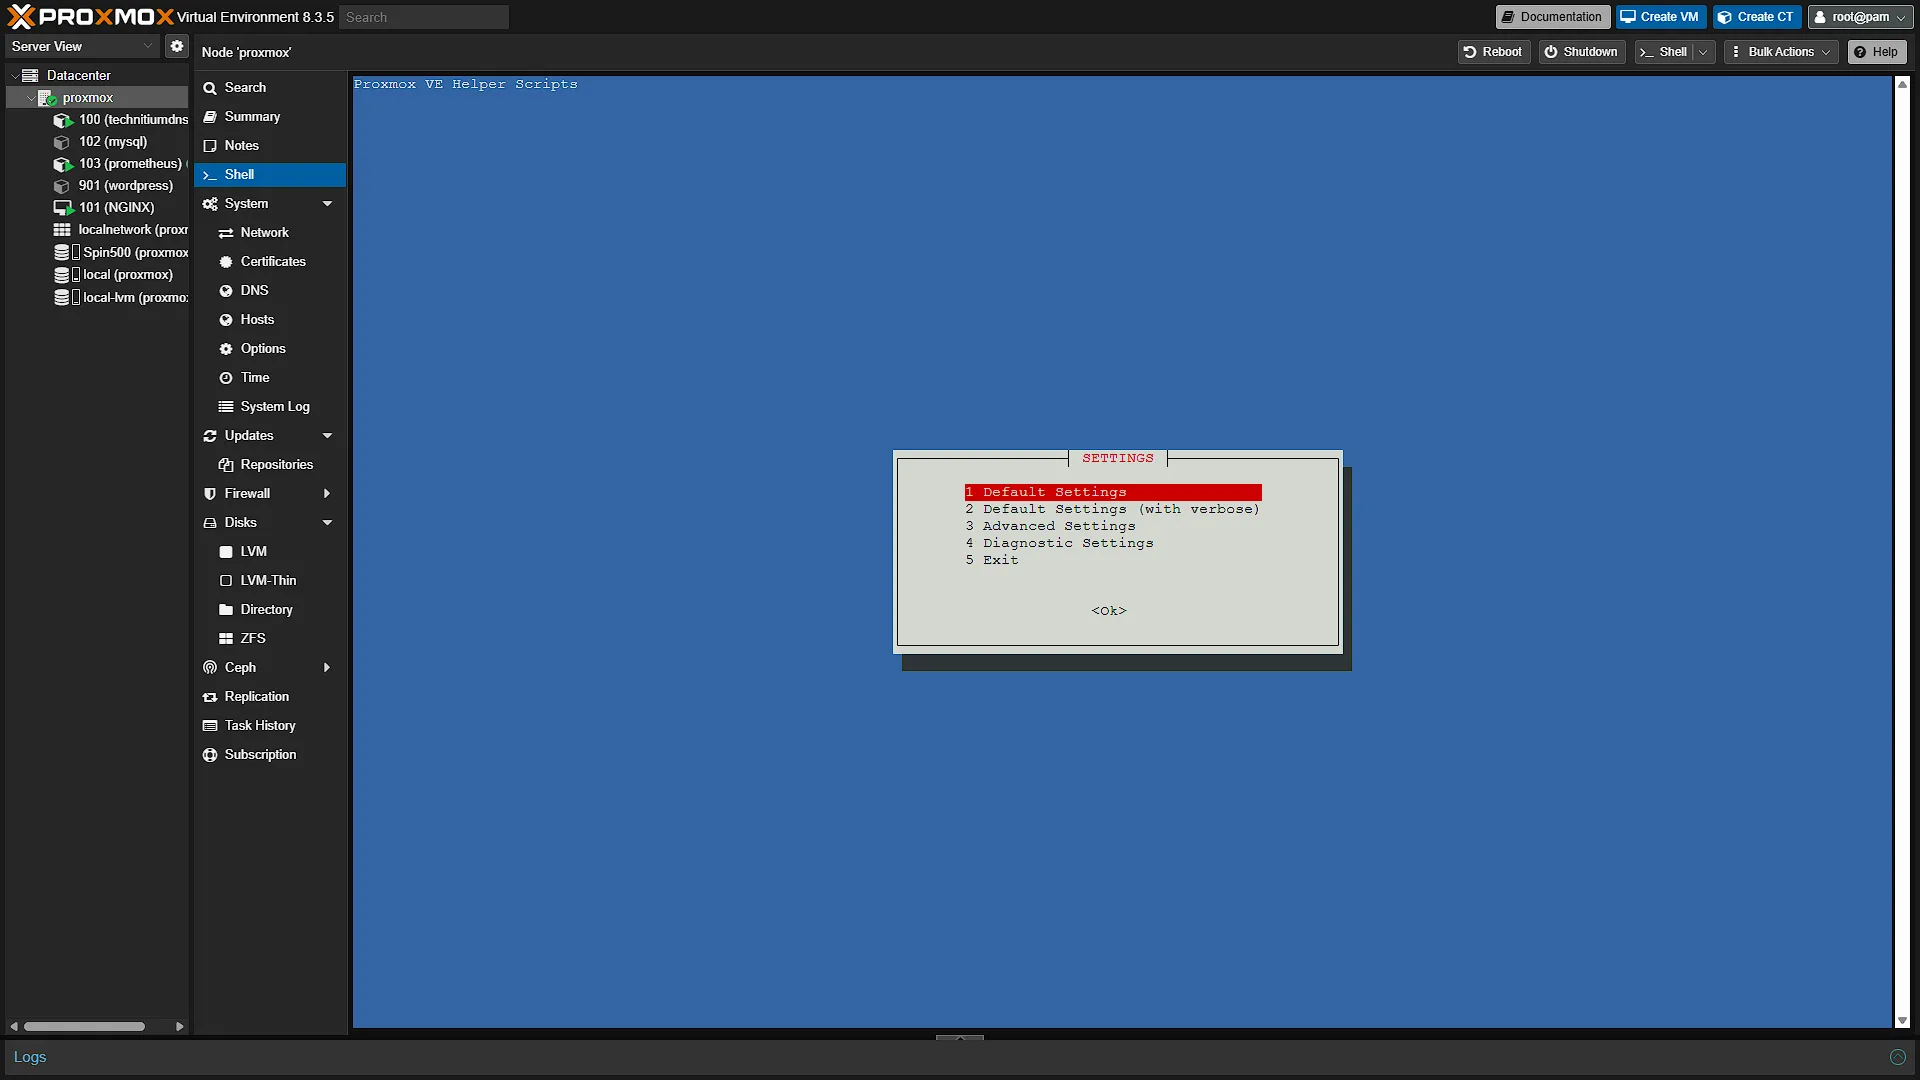
The second will be a screen where we can select the settings. If you want to change the settings, you are welcome, but we are sticking to the default and continuing.
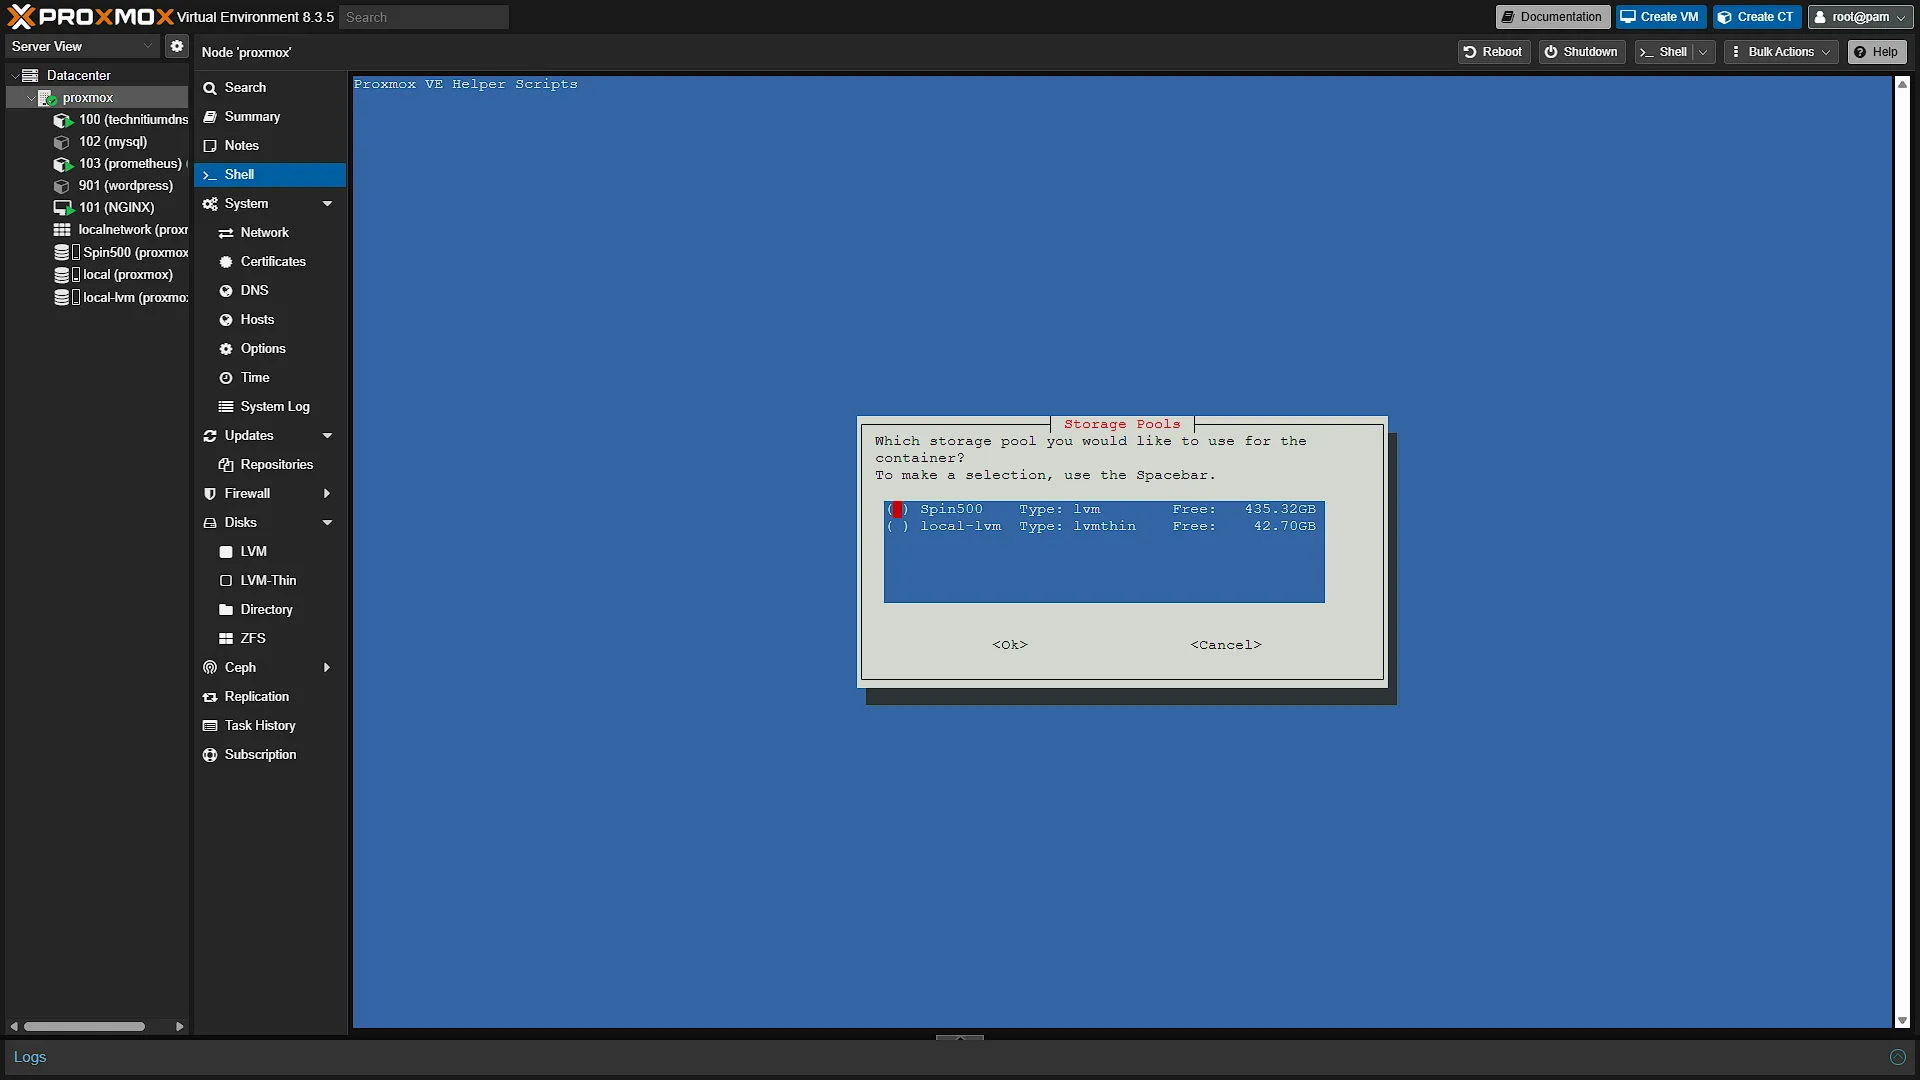
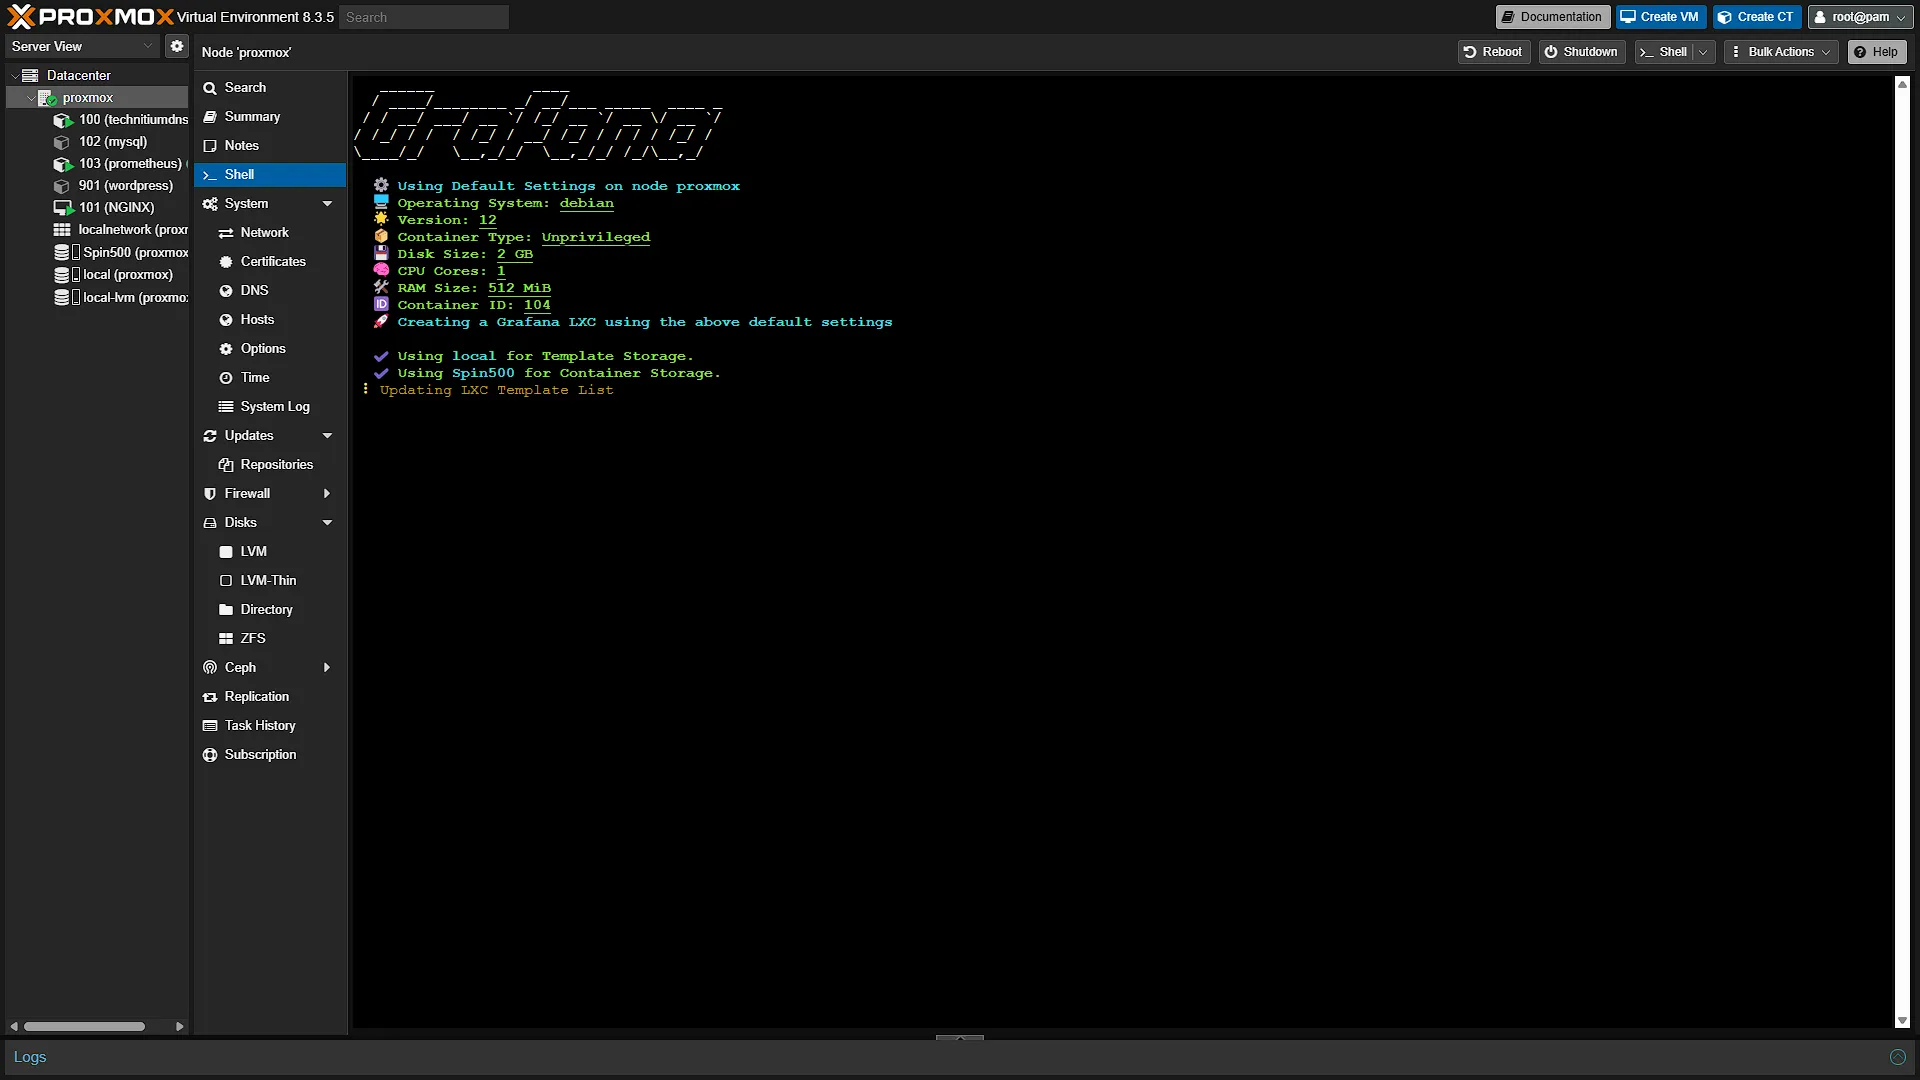
The third modal will ask us to select a disk to install Grafana. If you only have one disk, you will not see this screen. Either way, after this screen the install will start. It might take a few minutes, but once done, you will see a confirmation screen giving you the access URL.
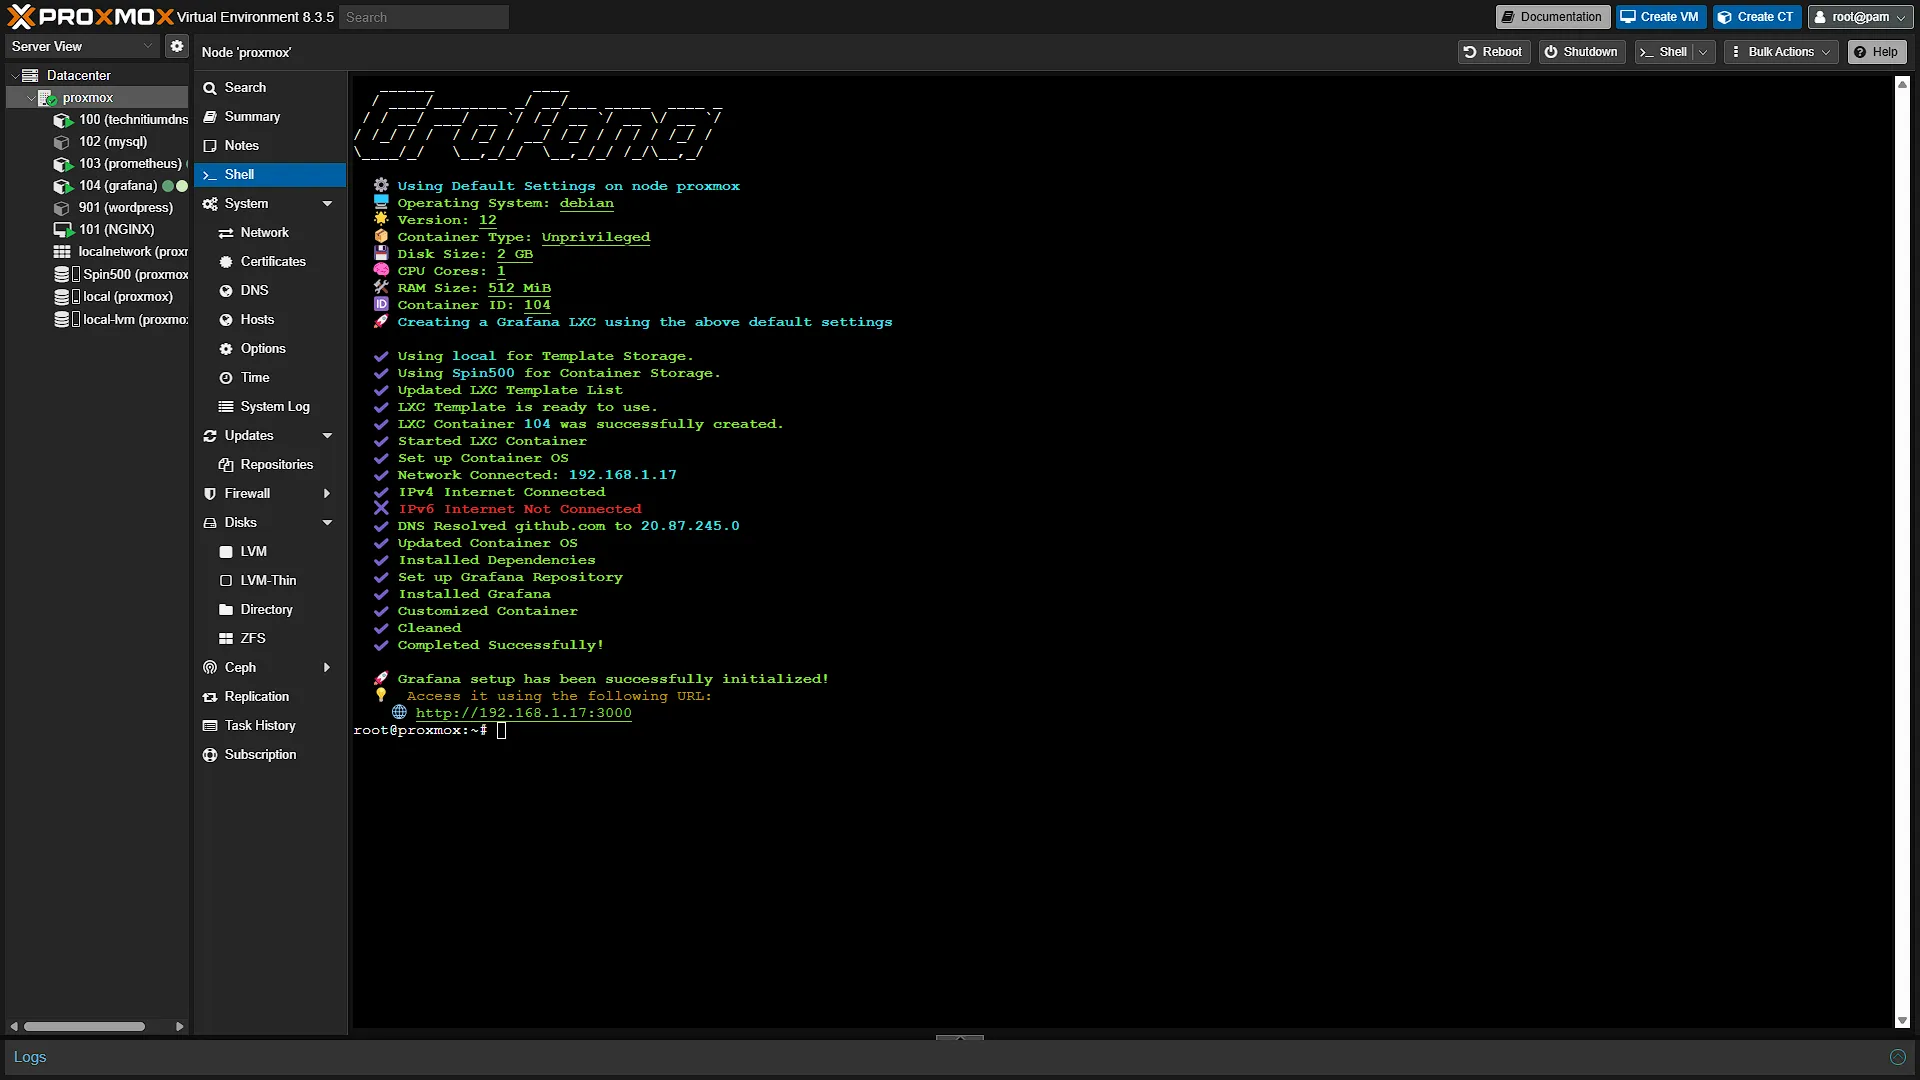
Step 2: Setup Grafana
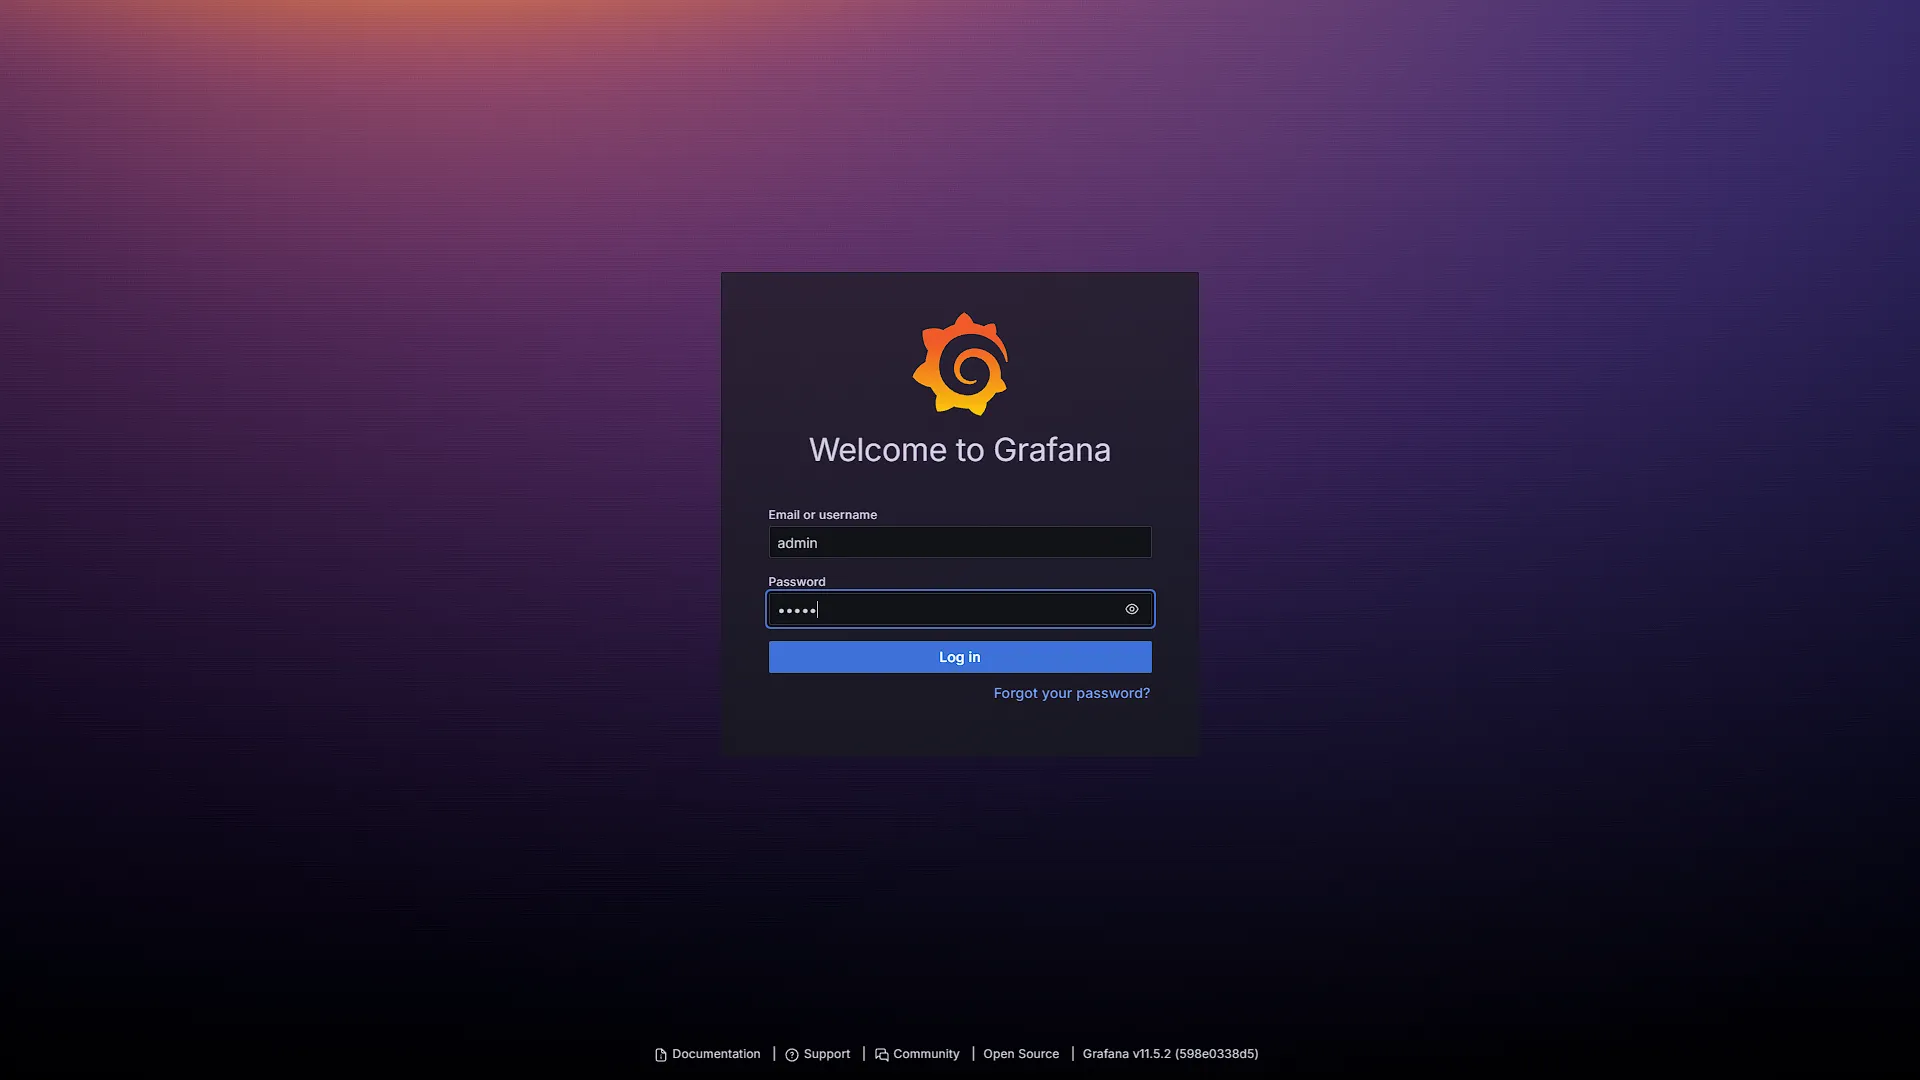
Access the Grafana dashboard in a new window as per the settings provided after install. You will be prompted to log in. Use the default credentials to log in:
Username: admin
Password: admin
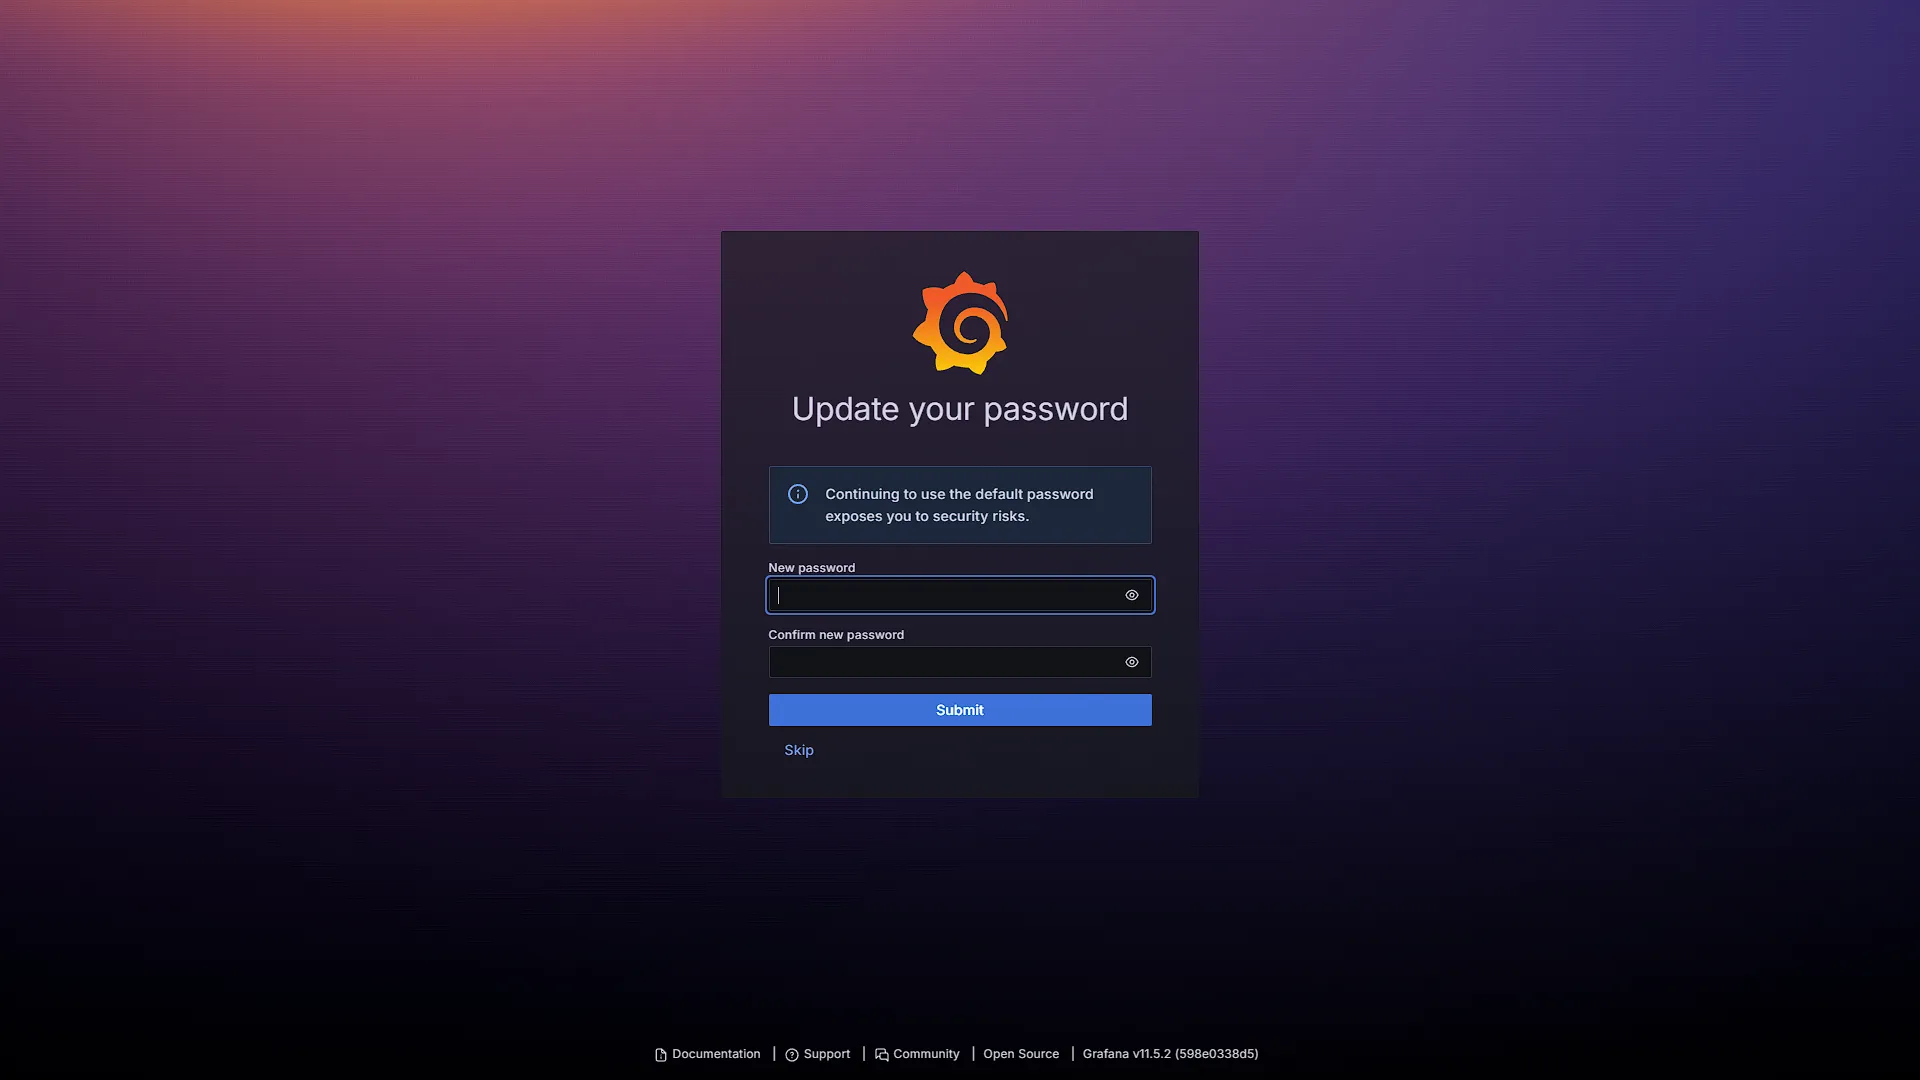
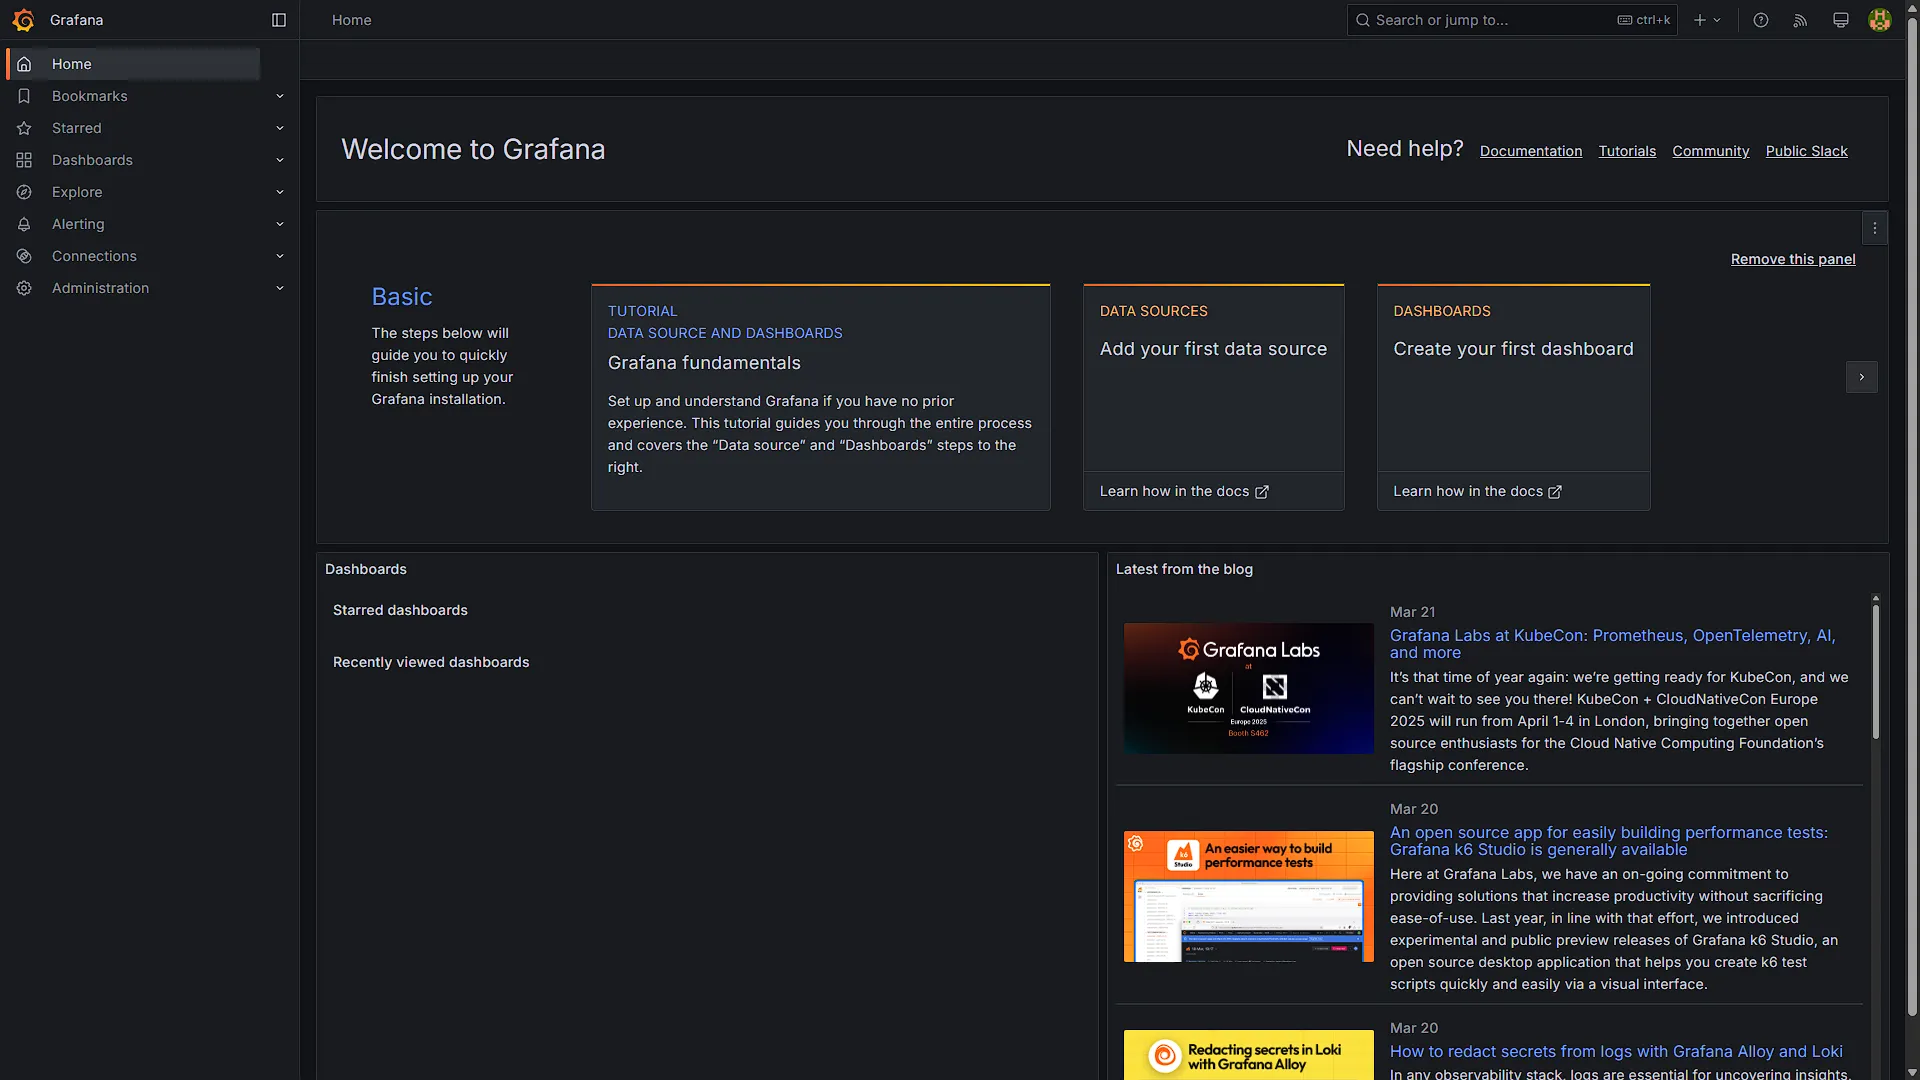
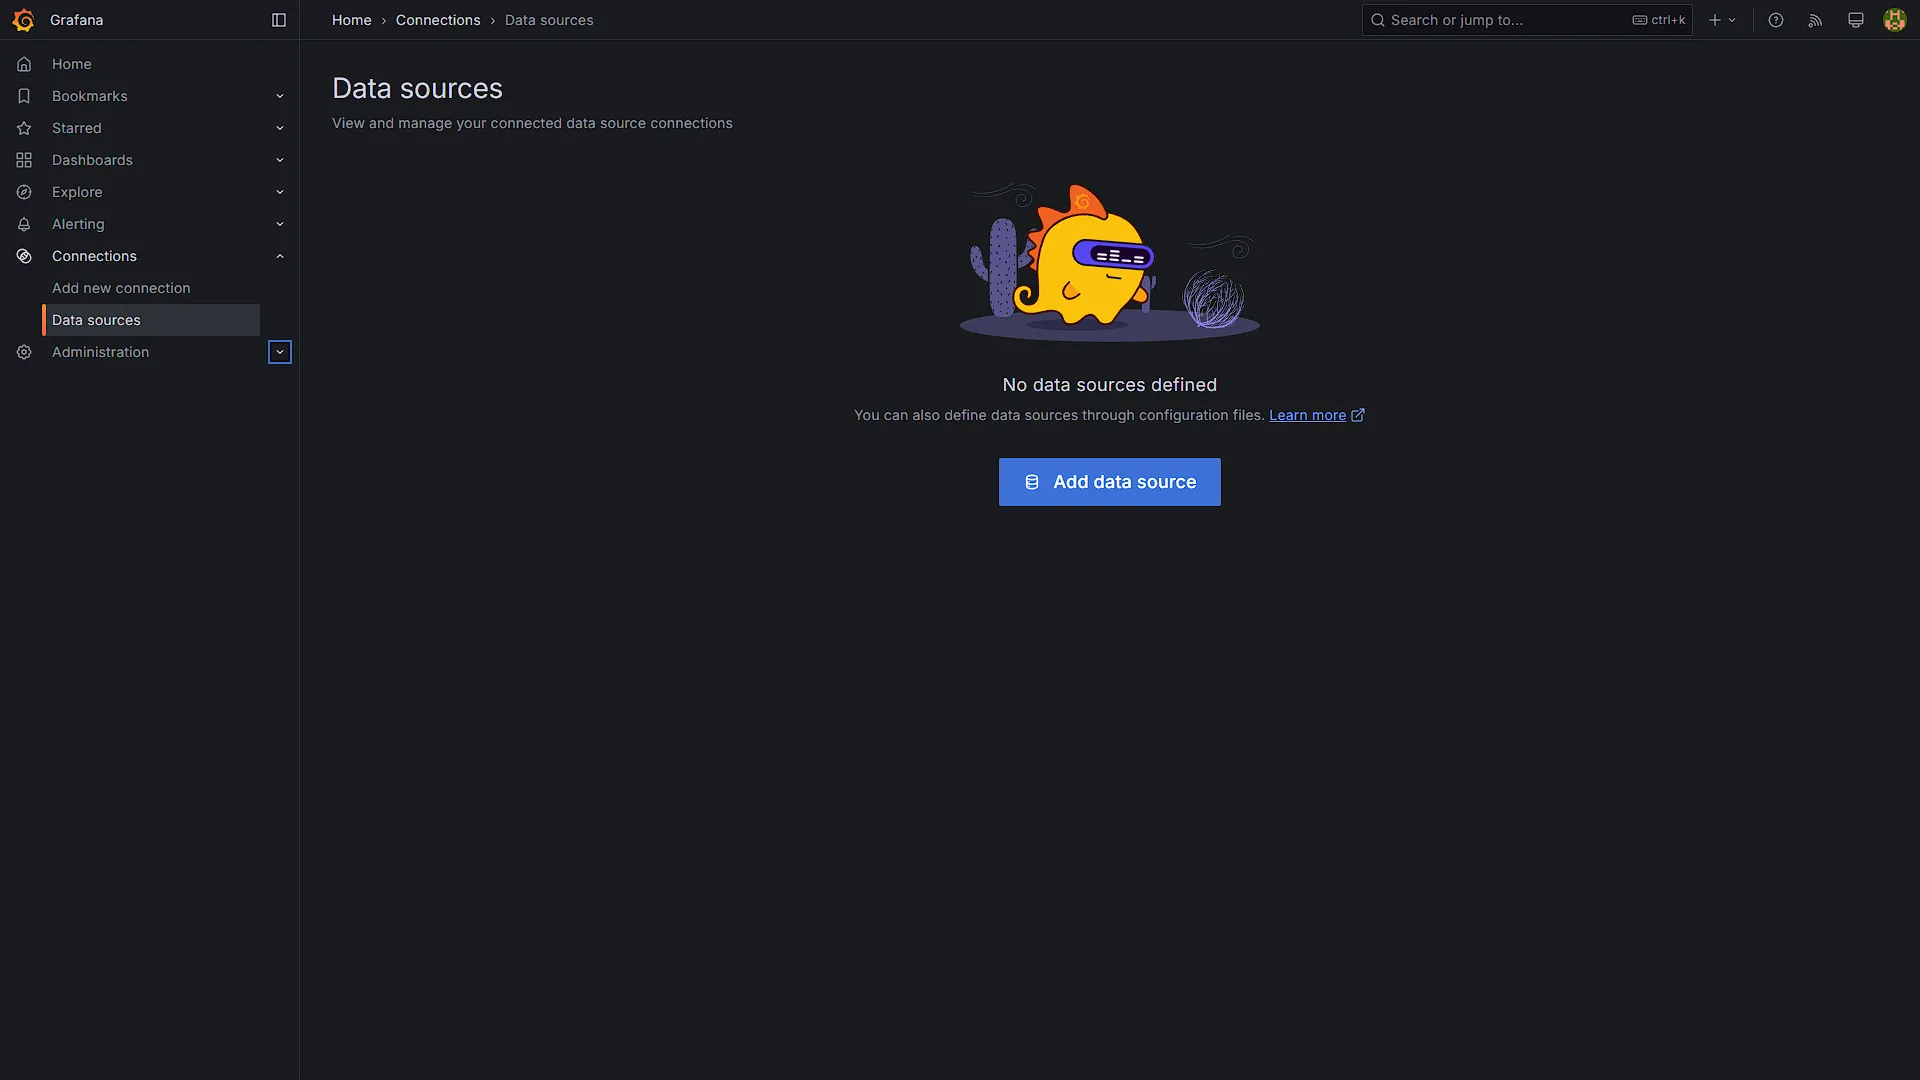
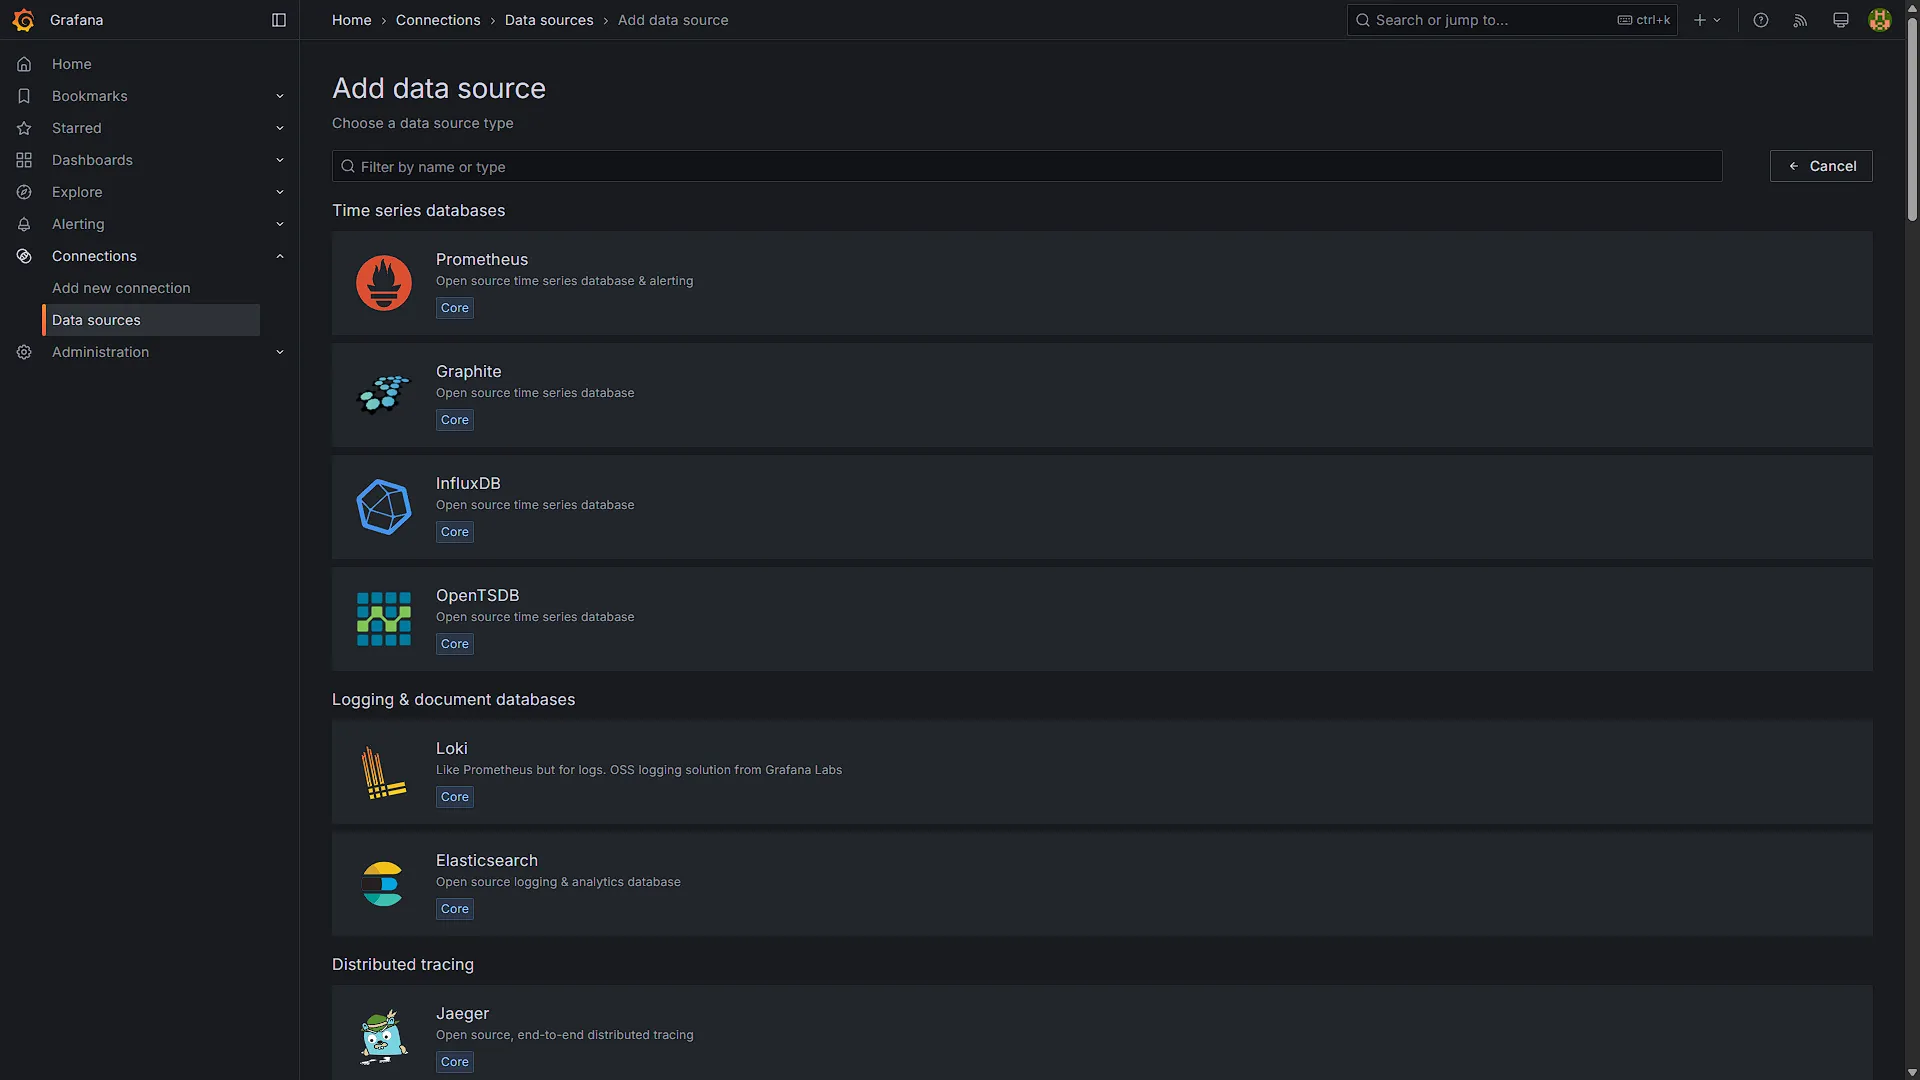
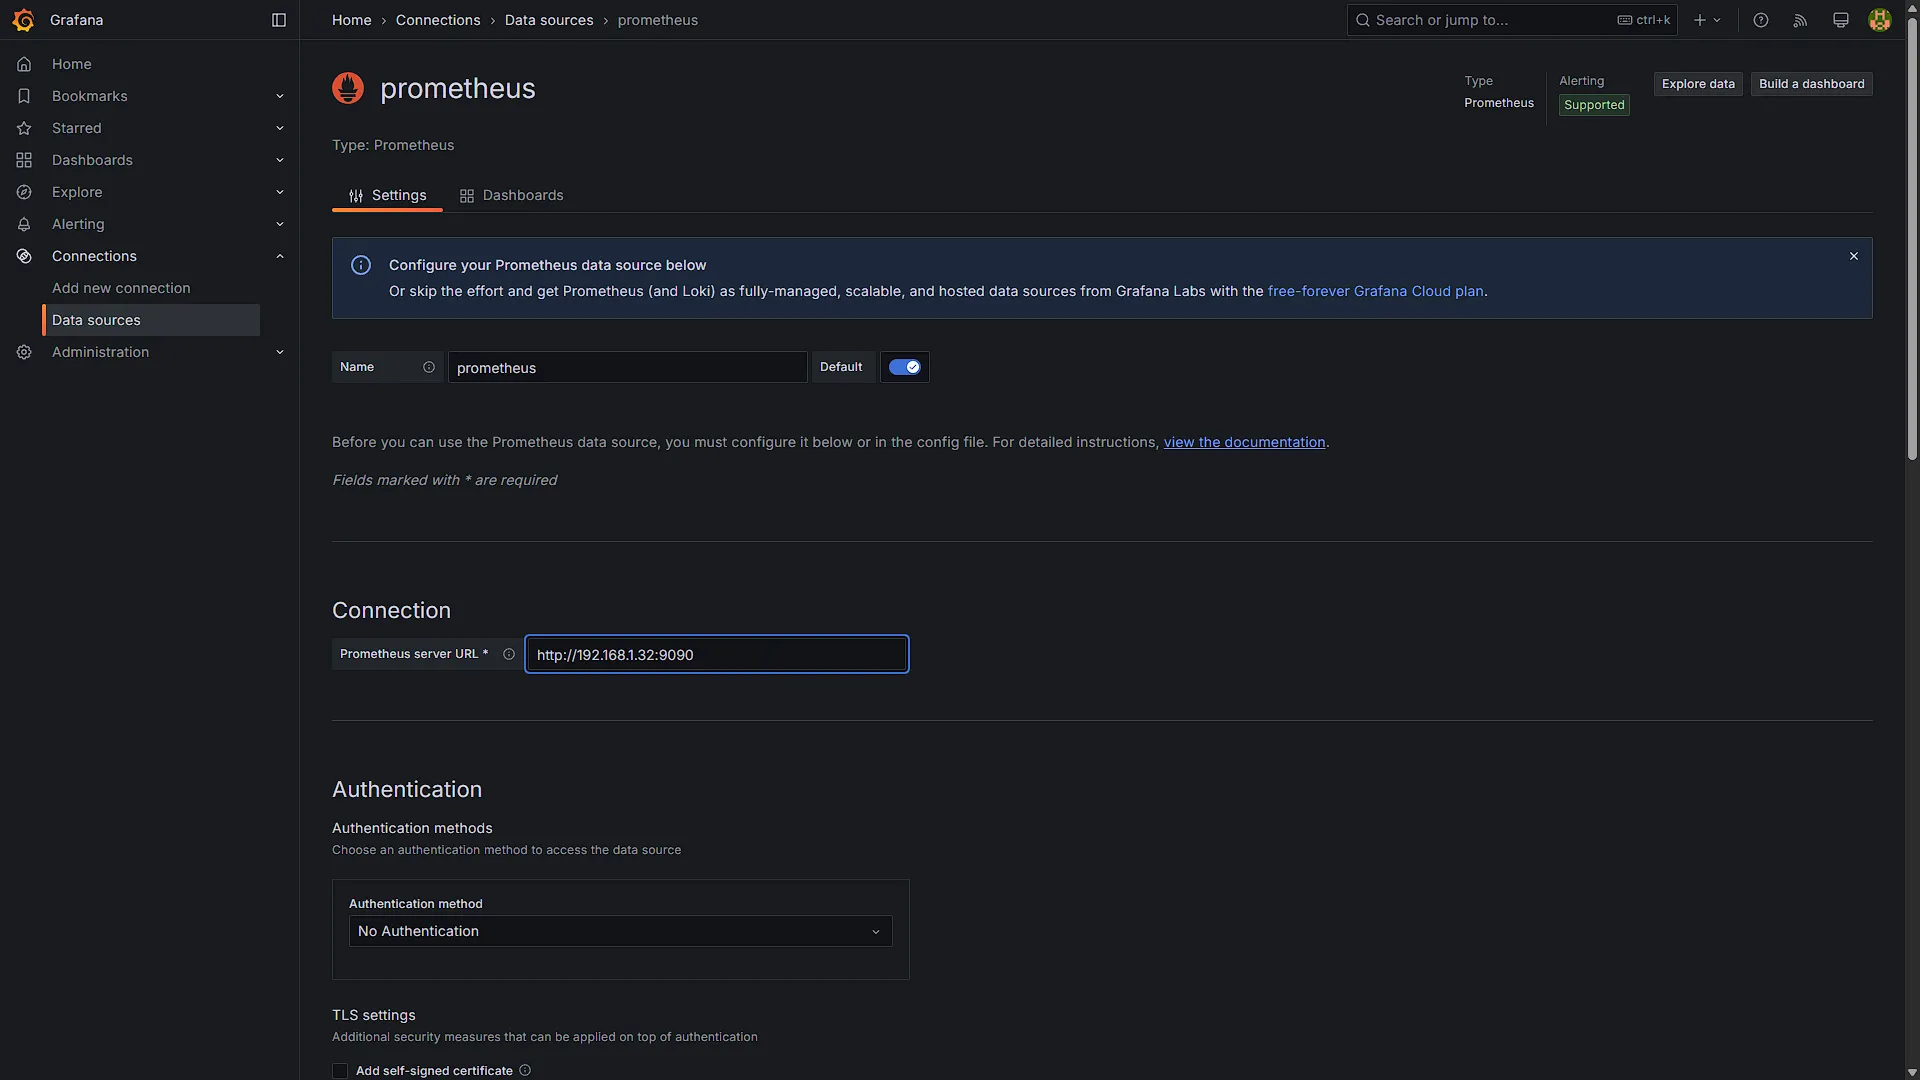
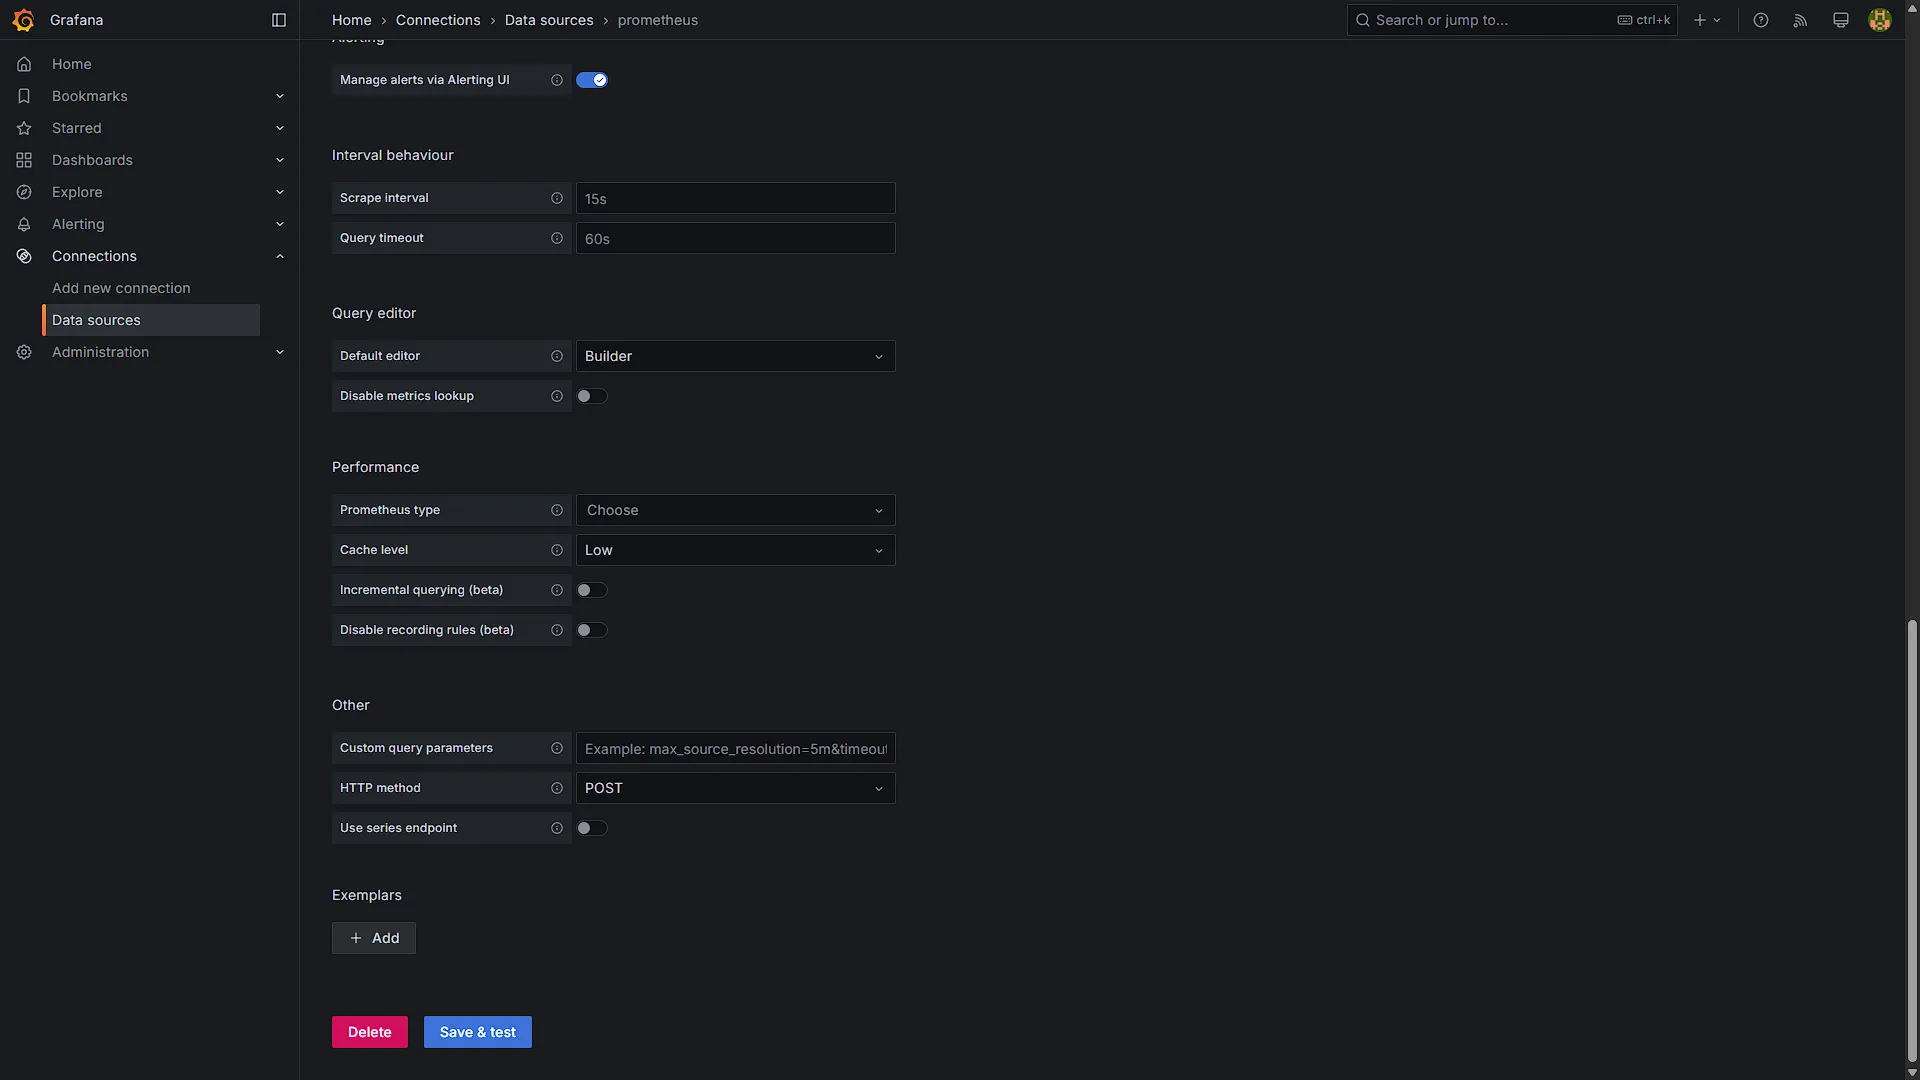
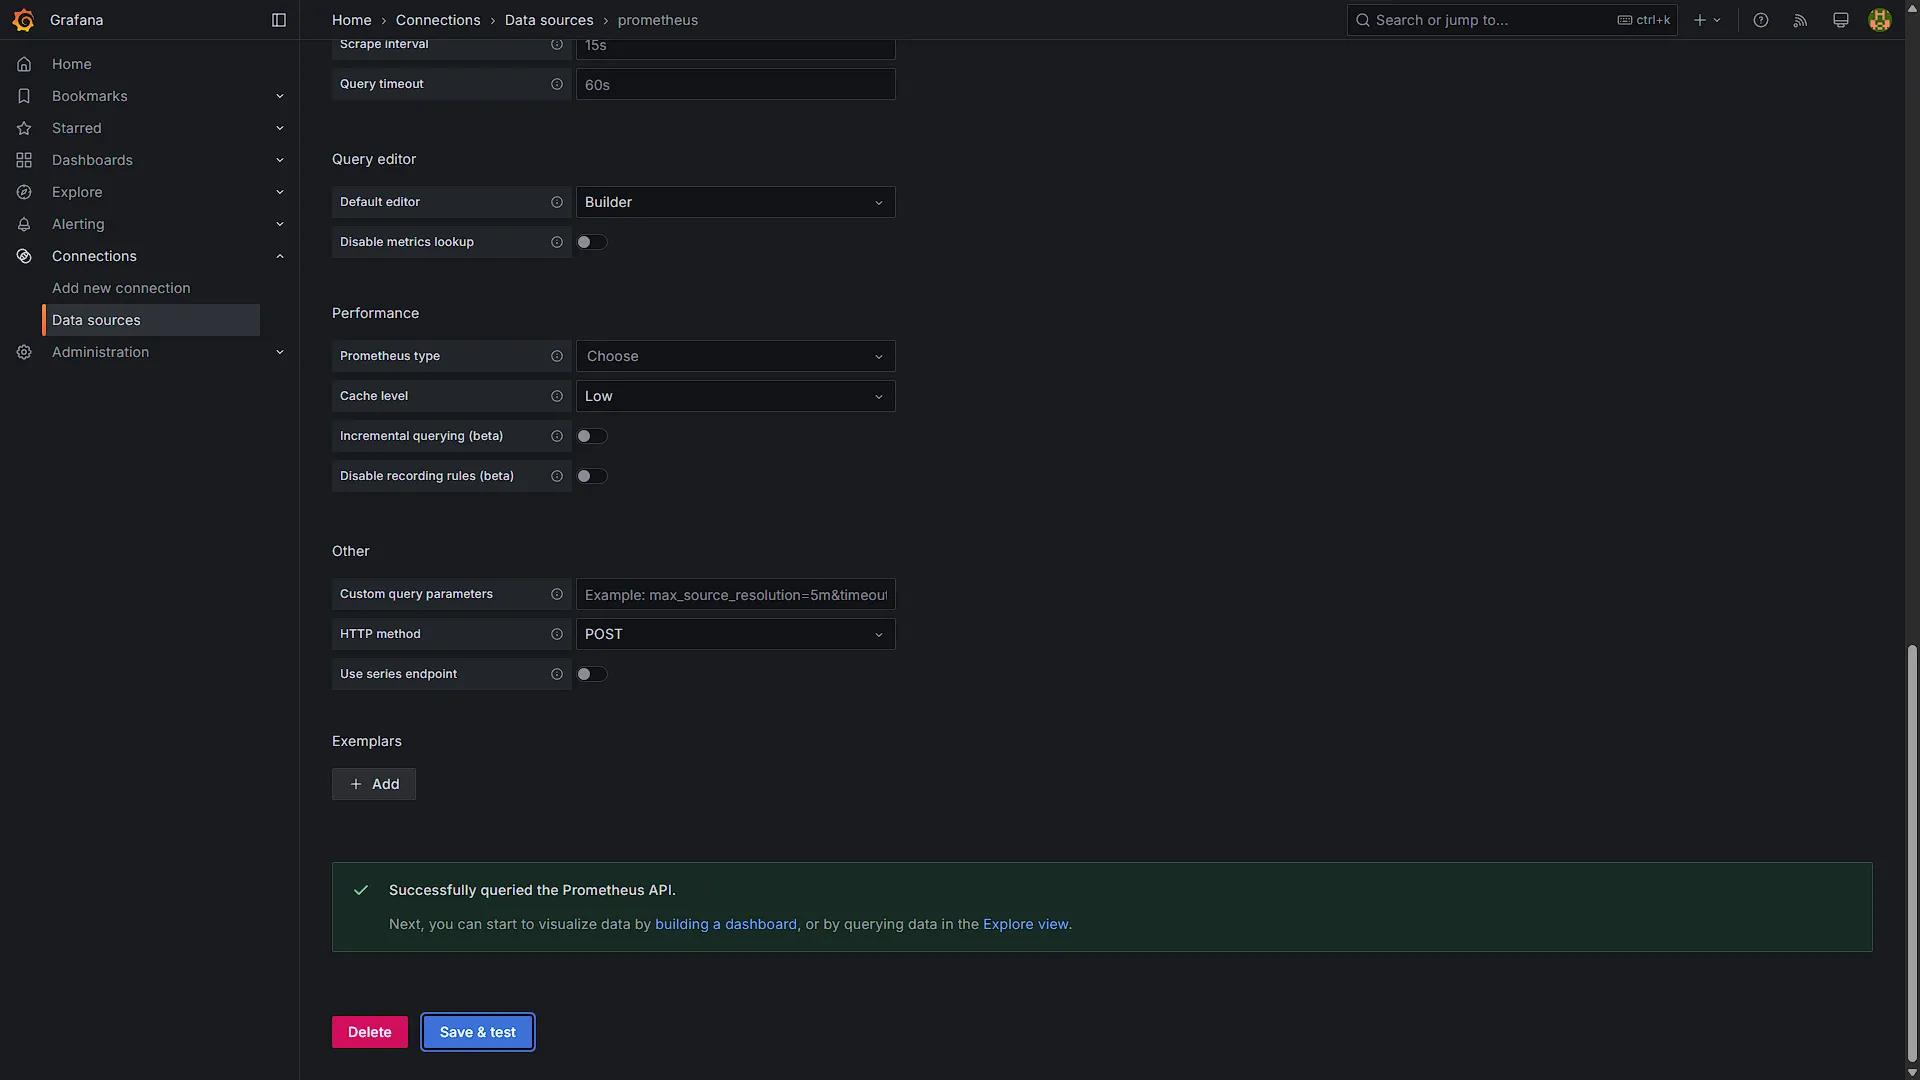
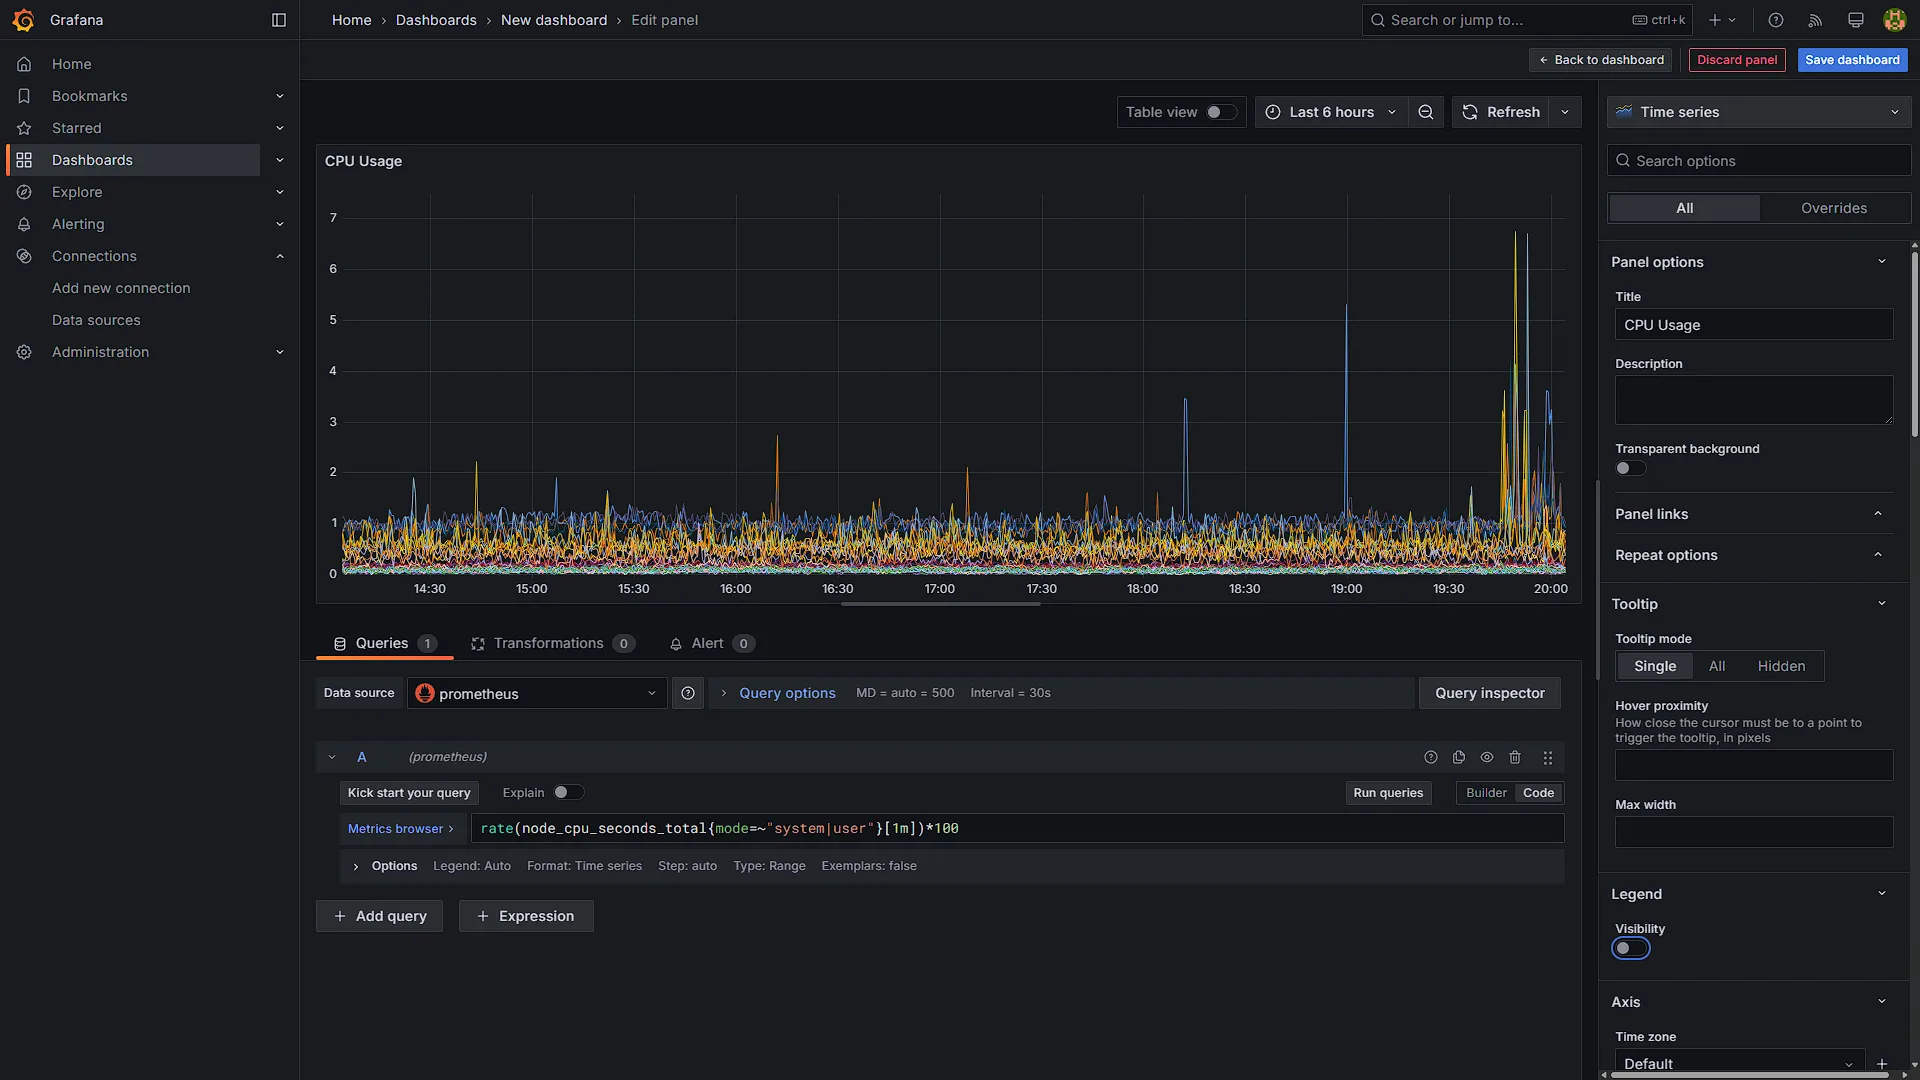
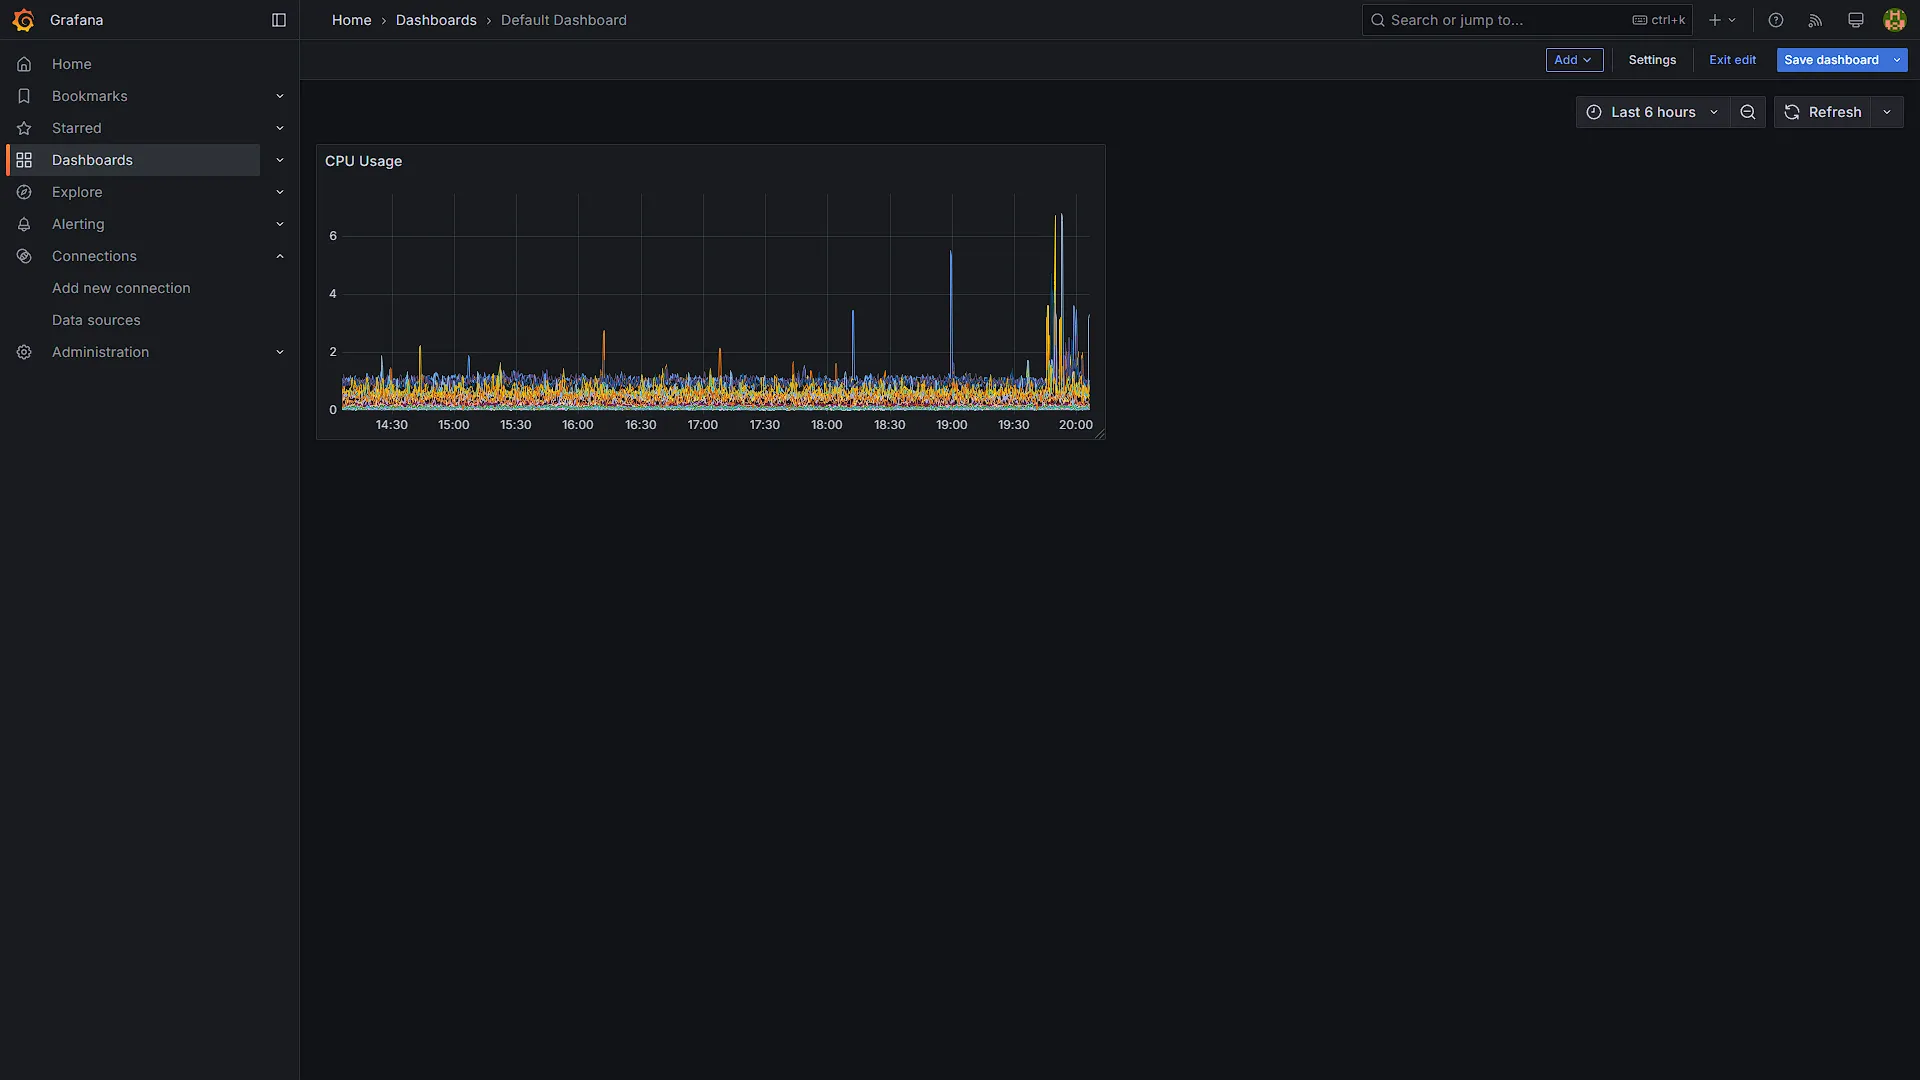
Once logged in, you will be prompted to select a new password for the admin account. Once added, in the left navigation pane, select Connections, and then Data Sources. We need to add a new data source, in our case we will select a Prometheus data source. Enter the IP address where you access Prometheus and click on Save & Test. If the data source was successfully added, we can start with a new visualisation. Instead of the builder, rather use the code tab and use any of the following presets:
CPU Usage per core: rate(node_cpu_seconds_total{mode=~"system|user"}[1m])*100
Network Traffic Received: rate(node_network_receive_bytes_total[1m])
Network Traffic Sent: rate(node_network_transmit_bytes_total[1m])
Hard Drive Usage: 100 - ((node_filesystem_avail_bytes{mountpoint="/",fstype!="rootfs"} * 100) / node_filesystem_size_bytes{mountpoint="/",fstype!="rootfs"})
Optional After the Walkthrough: Dashboard Imports, Proxying and Alerts
Build the panels in the screenshots first. Importing a community dashboard is optional and does not replace that explanation of data sources and queries. Node Exporter Full, dashboard 1860, expects node-exporter metrics and suitable labels. It will not magically populate panels for every service simply because Prometheus can scrape something on the same host.
When importing, select the existing Prometheus data source, choose a target that actually exports the required metrics, and check the dashboard's variables and time range. Empty panels can mean an incompatible exporter or label selection. Compare one panel query with Prometheus directly before changing the scrape configuration or installing more software. Save a copy of a working dashboard before editing it. Give panels units that match their metric, choose readable ranges and distinguish missing data from a measured zero. Compare one displayed value with the target's own operating-system report at approximately the same time; this helps expose a query or label mistake before it becomes a misleading alert.
An optional NGINX route must point to the Grafana IP reported by your installation on its configured web port. Keep that address distinct from the Prometheus server address. Follow Grafana's version-appropriate proxy/root-URL guidance, including its live WebSocket endpoint when used. A new standalone TLS server block also needs real certificate paths; a port-443 declaration by itself is not a complete configuration.
Alerts require deliberate rules, evaluation intervals and a tested contact point. A generic Grafana webhook body is not automatically a compatible ntfy message. Use a documented integration or an adapter that translates the payload, and test firing and recovery notifications. The Uptime Kuma/ntfy workflow in Part 28 is a separate integration. A useful dashboard should answer a specific question, such as which target is failing or which disk is filling, without relying on unverified download counts or a promise that importing takes a fixed number of seconds.
Further reading: Node Exporter Full dashboard, Grafana behind a proxy.
Conclusion
Now we have a great visual dashboard displaying our Prometheus data in a user-friendly and easy-to-understand way. This will keep logs of our Prometheus export nodes that can monitor all our services. We can use this data to see if we need to increase any resources for any app we are running, but also monitor if any service starts acting in a bad way so we can isolate and stop it. We hope you are enjoying our series so far, we will now start with some more useful and fun apps to use in your Homelab.