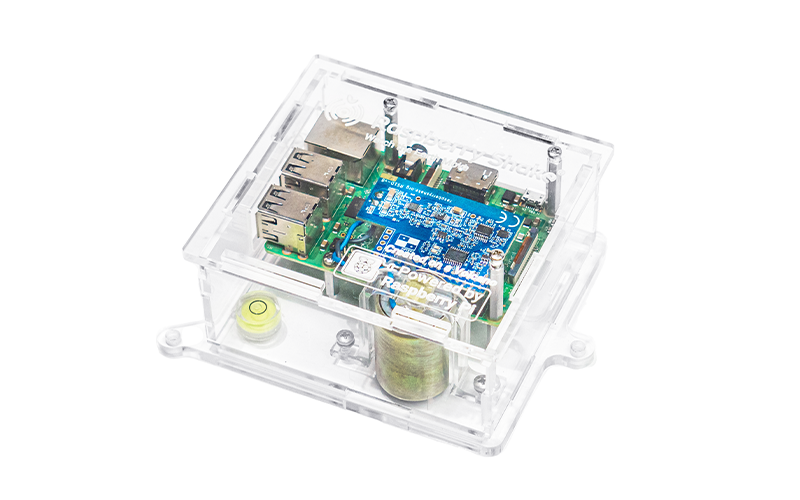
Raspberry Shake brings seismic observation into homes and classrooms using dedicated sensors connected to a supported Raspberry Pi. It can help you explore ground motion and contribute observations to a wider network. A useful station needs careful placement, correct metadata and realistic interpretation; a bump on a graph is not automatically an earthquake.
From Local Tremors to a Global Network
The Raspberry Shake project combines instruments, viewing tools and a community of station operators. The number of installed or currently online stations changes, so this guide does not treat an undated count as a current measurement. Use the live station map to see the network at the time you visit.
Choose whether to explore existing data first or operate your own instrument. A classroom can compare stations around a known event without immediately buying hardware. If you do install a station, its usefulness depends on consistent recording and a clear description of the site, not simply having another marker on the map.
What the Instrument Measures
A seismograph records motion at its own location. Household equipment, traffic and other nearby activity can produce signals alongside natural events. A station can be an educational observation tool without providing a complete picture of all earthquakes near it.
The model specifications distinguish vertical-motion, three-component and strong-motion instruments. Match the sensor to the observation you want to make rather than choosing a model from an absolute earthquake-magnitude threshold.
| Model | Main sensor arrangement | Useful distinction |
|---|---|---|
| RS1D | Vertical geophone | Records one ground-motion component. |
| RS3D | Three orthogonal geophones | Records vertical and horizontal components. |
| RS4D | Vertical geophone plus three-axis accelerometer | Adds strong-motion measurement; every sensor still has finite limits. |
| RS&BOOM | Vertical geophone plus infrasound sensor | Combines ground motion and atmospheric pressure observations. |
The separate RBOOM is historical hardware: the hardware changelog records its discontinuation. The current combined model should not be confused with that older pressure-only instrument. Check the exact hardware revision and its supported Pi boards when ordering a kit; a GPIO connector alone does not establish compatibility with every Pi.
Install for a Useful Noise Baseline
Follow the quick-start guide for the selected model, power supply, software image and network connection. Use http://rs.local/ on the local network; if that name does not resolve, identify the instrument's address through your router rather than assuming the station is broken.
The installation FAQ recommends a quiet location and cautions against noise from the Pi's built-in Wi-Fi. Ethernet is a useful starting point. A concrete slab on a low floor can help, but nearby machinery and the site itself still determine the noise you record. Follow the enclosure and environmental requirements for an outdoor placement.
Record a normal day before tuning alerts. Note events you can independently identify, such as a washing machine running or a nearby door closing. Keep the time and station configuration with those notes. Avoid moving or tapping the instrument while treating that period as a natural baseline.
Explore the Live Station Map
Use StationView to explore available stations and their context. If the embedded service is unavailable in your browser, open the original map directly.
Compare the same time interval and channel when looking at two stations. A distant station may have a very different noise environment and instrument. Differences in graph appearance are not enough to conclude that one station failed to detect an event.
Interpret Events with Independent Evidence
The USGS earthquake explanation describes how differences between P- and S-wave arrivals help estimate distance. Location normally combines observations from several stations with appropriate travel-time information. One noisy home trace does not provide an exact epicentre merely by subtracting two times.
Detectability depends on the event, distance, sensor response, site noise and processing. There is no universal promise that every nearby M1.5 event or every worldwide M6.5 event will appear clearly. Likewise, travel time depends on the source and path; a fixed 12–20-minute arrival window is not a general rule.
Use an independently published event's origin time and location as a starting point. Check the station's clock, relevant time zone and the predicted or reported arrival context. Look for consistent evidence on other stations before labelling an ambiguous spike. Preserve the unprocessed observation so that a later interpretation can be checked.
Accelerometers add a useful range for strong motion, but “never clips” is not a defensible specification. Consult the revision's instrument response and limits. Infrasound also records pressure variation from several possible causes; the waveform alone does not establish that a particular meteor, launch or eruption produced it.
Optional Local Data and Alerts
The DATACAST guide describes sending data to a chosen receiving host and UDP port. Configure the real receiver address, allow only the necessary local traffic and confirm that samples arrive before adding alerts. UDP can lose packets and is not a guarantee of complete research-quality delivery.
The original rsudp link is retained. Its documented modules can display data and trigger sudden-motion alerts. An STA/LTA trigger compares shorter and longer signal windows; a threshold crossing is a candidate event, not automatic earthquake confirmation. Tune it using the site's ordinary noise and review false alerts.
Check the supported modules and installation instructions before assuming a built-in Docker image or direct integration with every chat service and Home Assistant. Any custom automation should clearly identify its experimental status. A private local alert is an observation aid, not an official early-warning or emergency response service.
Keep Observations Useful Over Time
Decide deliberately whether to forward station data to the community, and check the project settings and sharing terms. Keep accurate site information and note changes in location or nearby noise sources. Save configurations and important observations with timestamps and channel details.
For a school project, compare an ordinary noisy period, a quieter period and a known event where data is available. Explain why the evidence differs and what cannot be concluded from it. Those repeatable observations offer more scientific value than guaranteeing detection or treating every alert as proof of an earthquake.