Now that we have Uptime Kuma running in our Docker LXC Container, we can start monitoring our other services in our Homelab. We can also alert ourselves if one of the services goes down, with the help of the ntfy instance we have running that can send notifications to our phone. Let's get started with the setup of Uptime Kuma and the integration into ntfy.
Step 1: Setting up a new Topic in ntfy
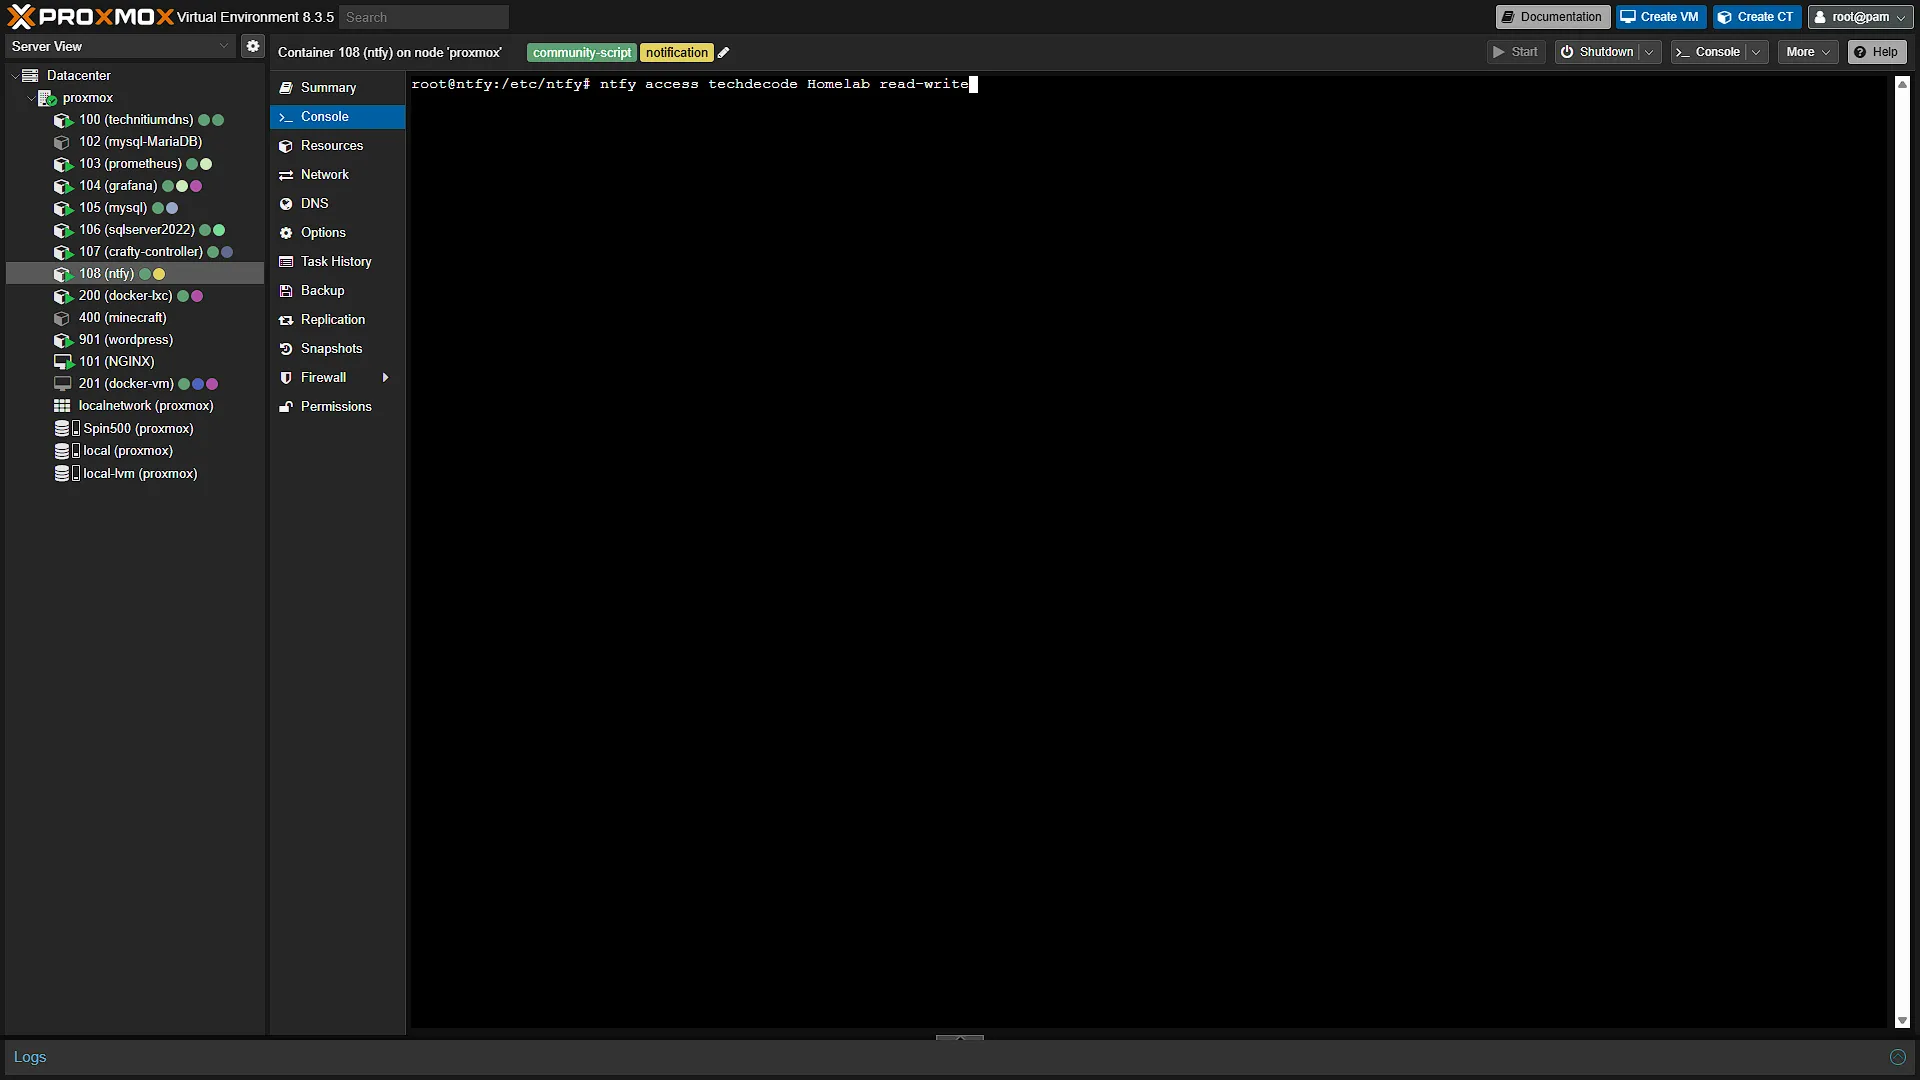
If you are following along with our Build your own homelab series, we will have locked down our ntfy instance running as an LXC container in our Proxmox, but we also only have one topic, Test to publish notifications to. Let's get a new topic added that is a bit more descriptive. But first we will need to give the correct access rights. For this, open your Proxmox in a new browser window and log in. In the left navigation pane, expand Datacenter and then expand the Proxmox node that contains your ntfy instance. Select the LXC running ntfy and in the middle navigation pane, select  to open the integrated console in the main window. Log in if you need to log in. Once logged in, we need to run the ntfy commands to give access to our set up user to a new topic, in our case we are going to call it
 Homelab.
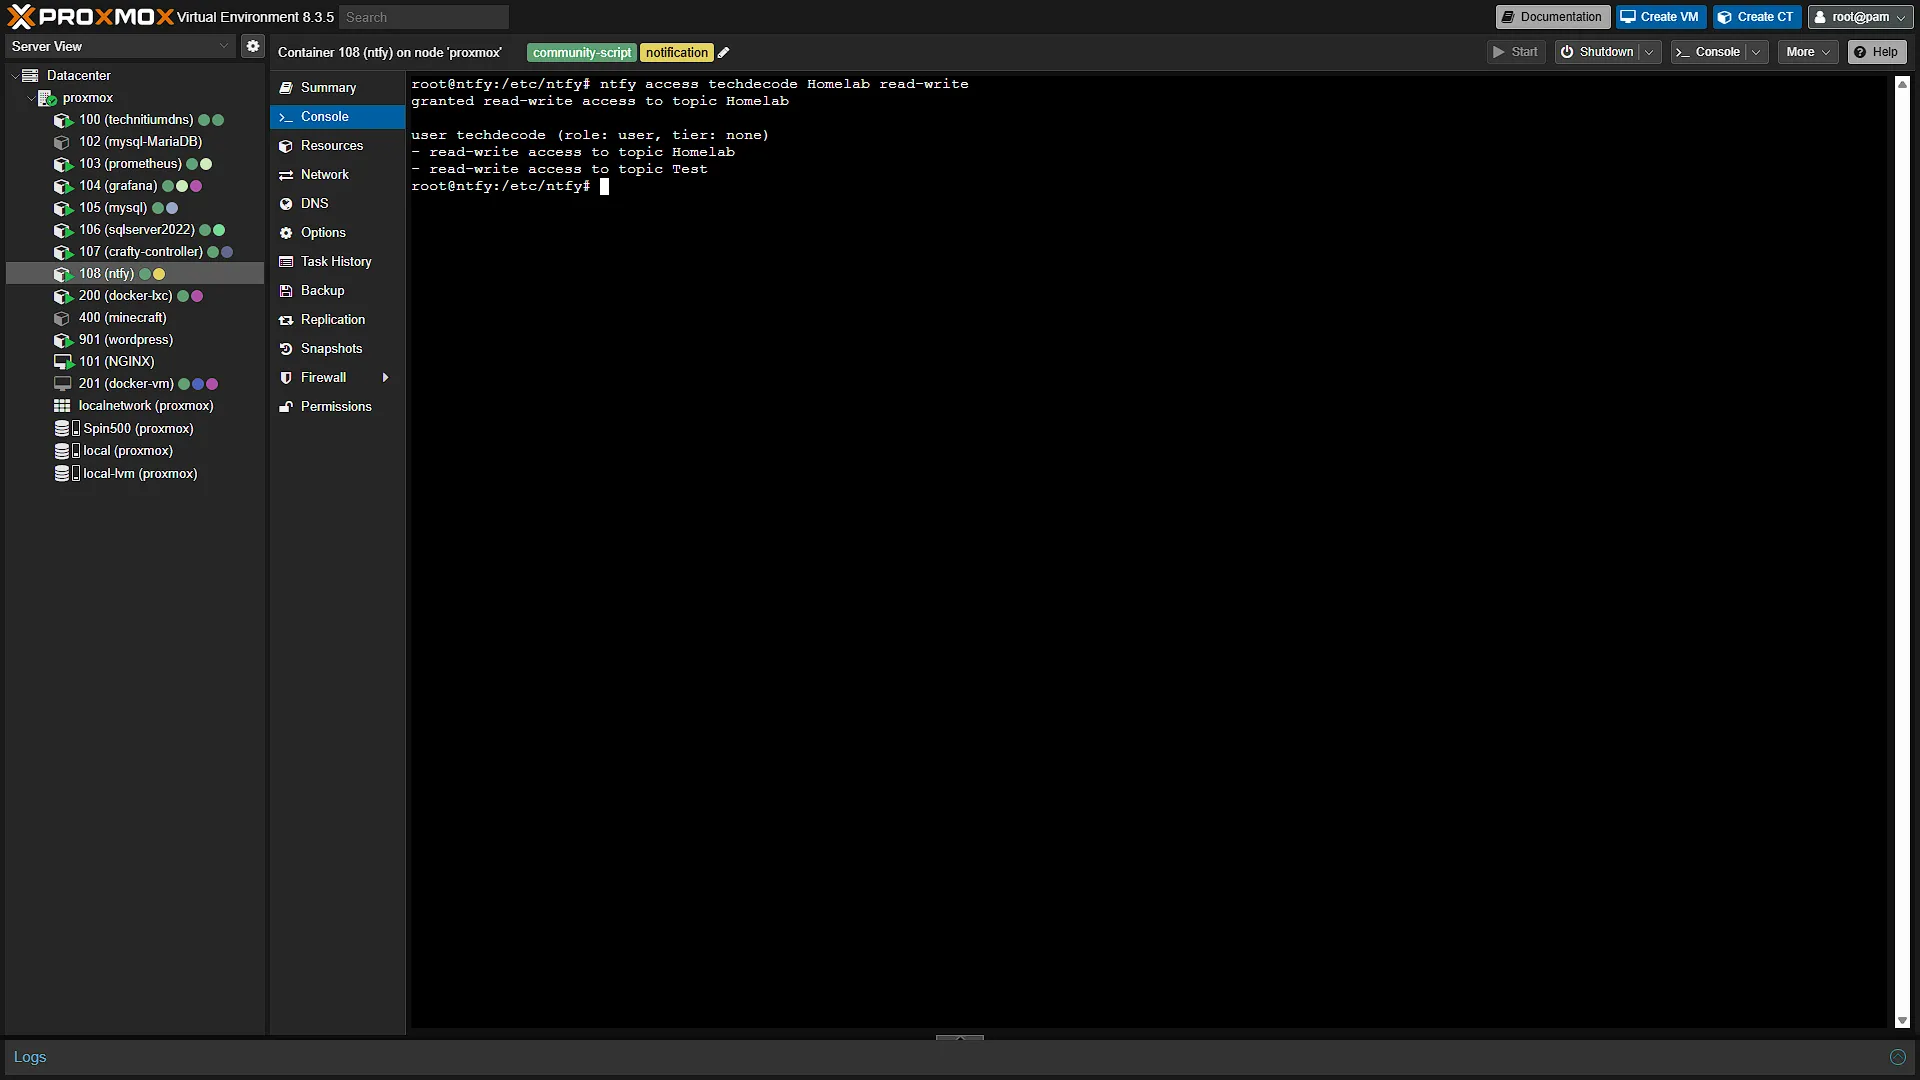
ntfy access techdecode Homelab read-writeIn the above example, we are giving read-write access to the Homelab topic for a user with the username techdecode. We created this user as part of our article on securing ntfy, so please make sure that the username is correct according to what you created in your own homelab.
We now have access to that topic for the existing user to both send and receive notifications.
Step 2: Set up the new topic on your phone
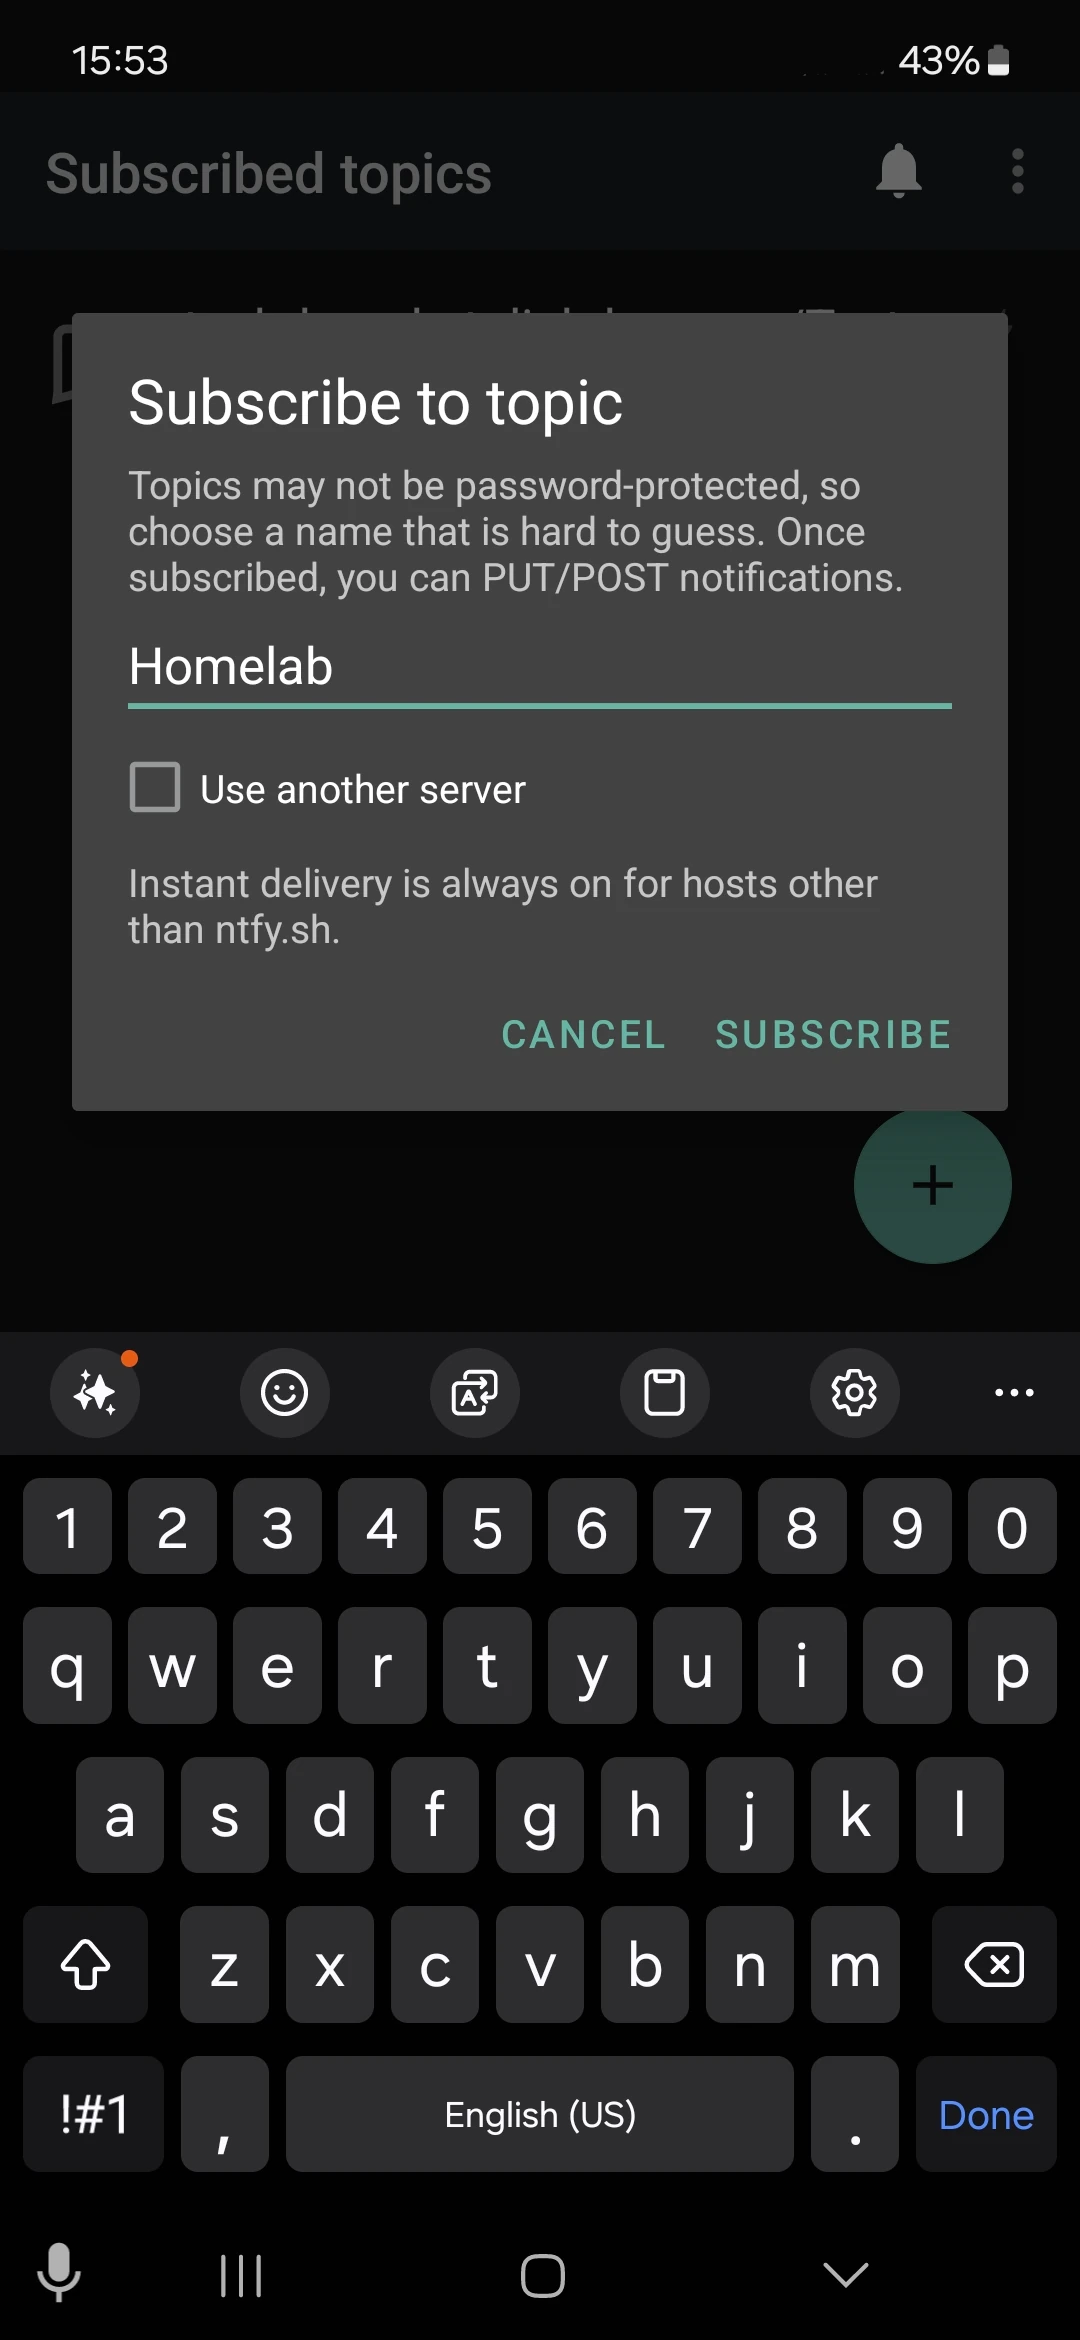
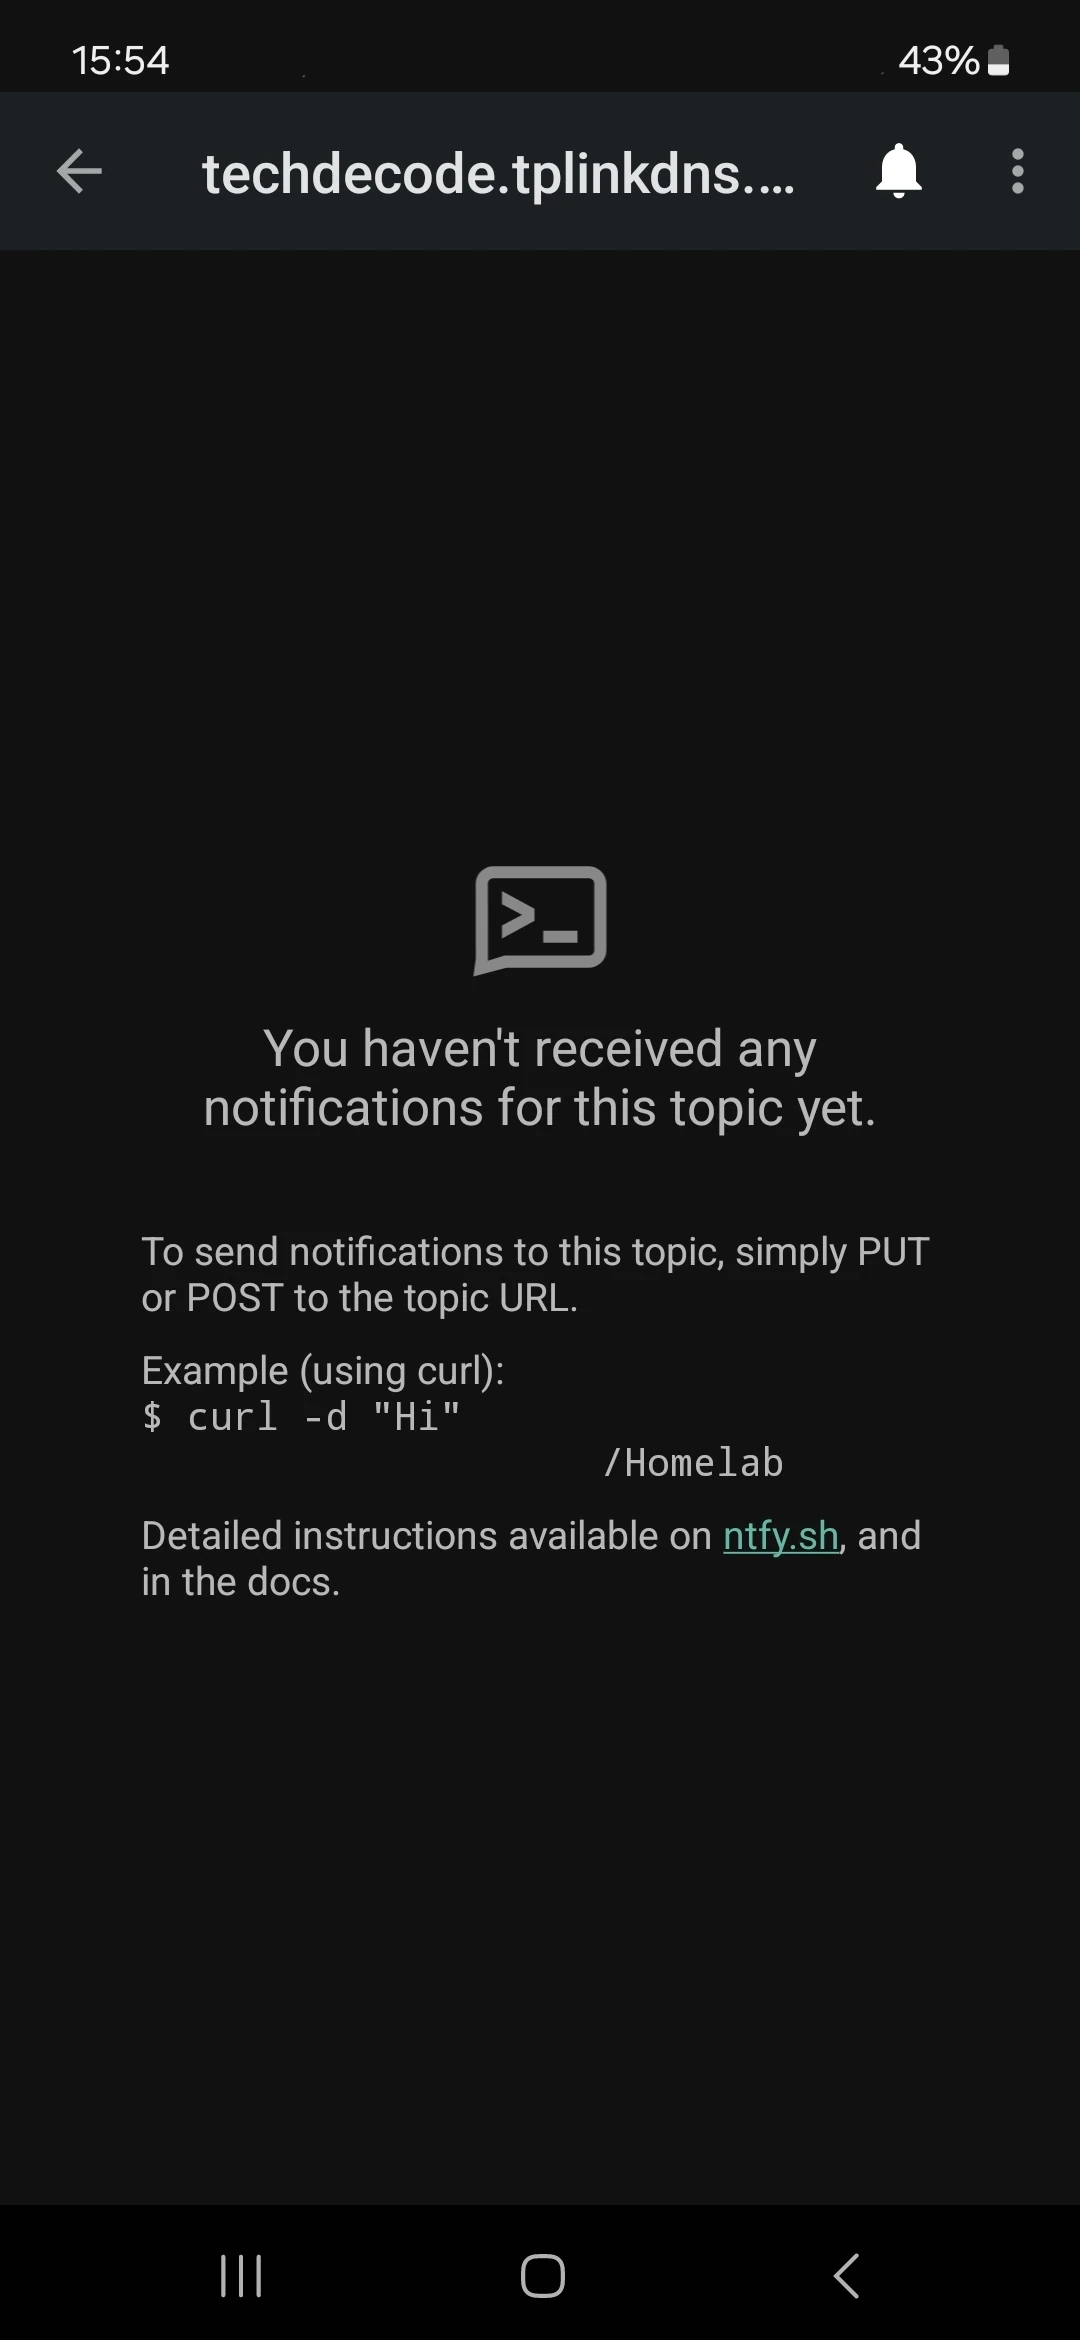
When we set up our notifications on our phone and also enabled it to be accessed from outside of our home network, we only subscribed to the Test topic. Open your ntfy app on your phone and select the Add Topic button. We should be able to just add it as Homelab as the default server stays the same and the user credentials we added when securing ntfy will also stay the same.
Step 3: Set up Uptime Kuma
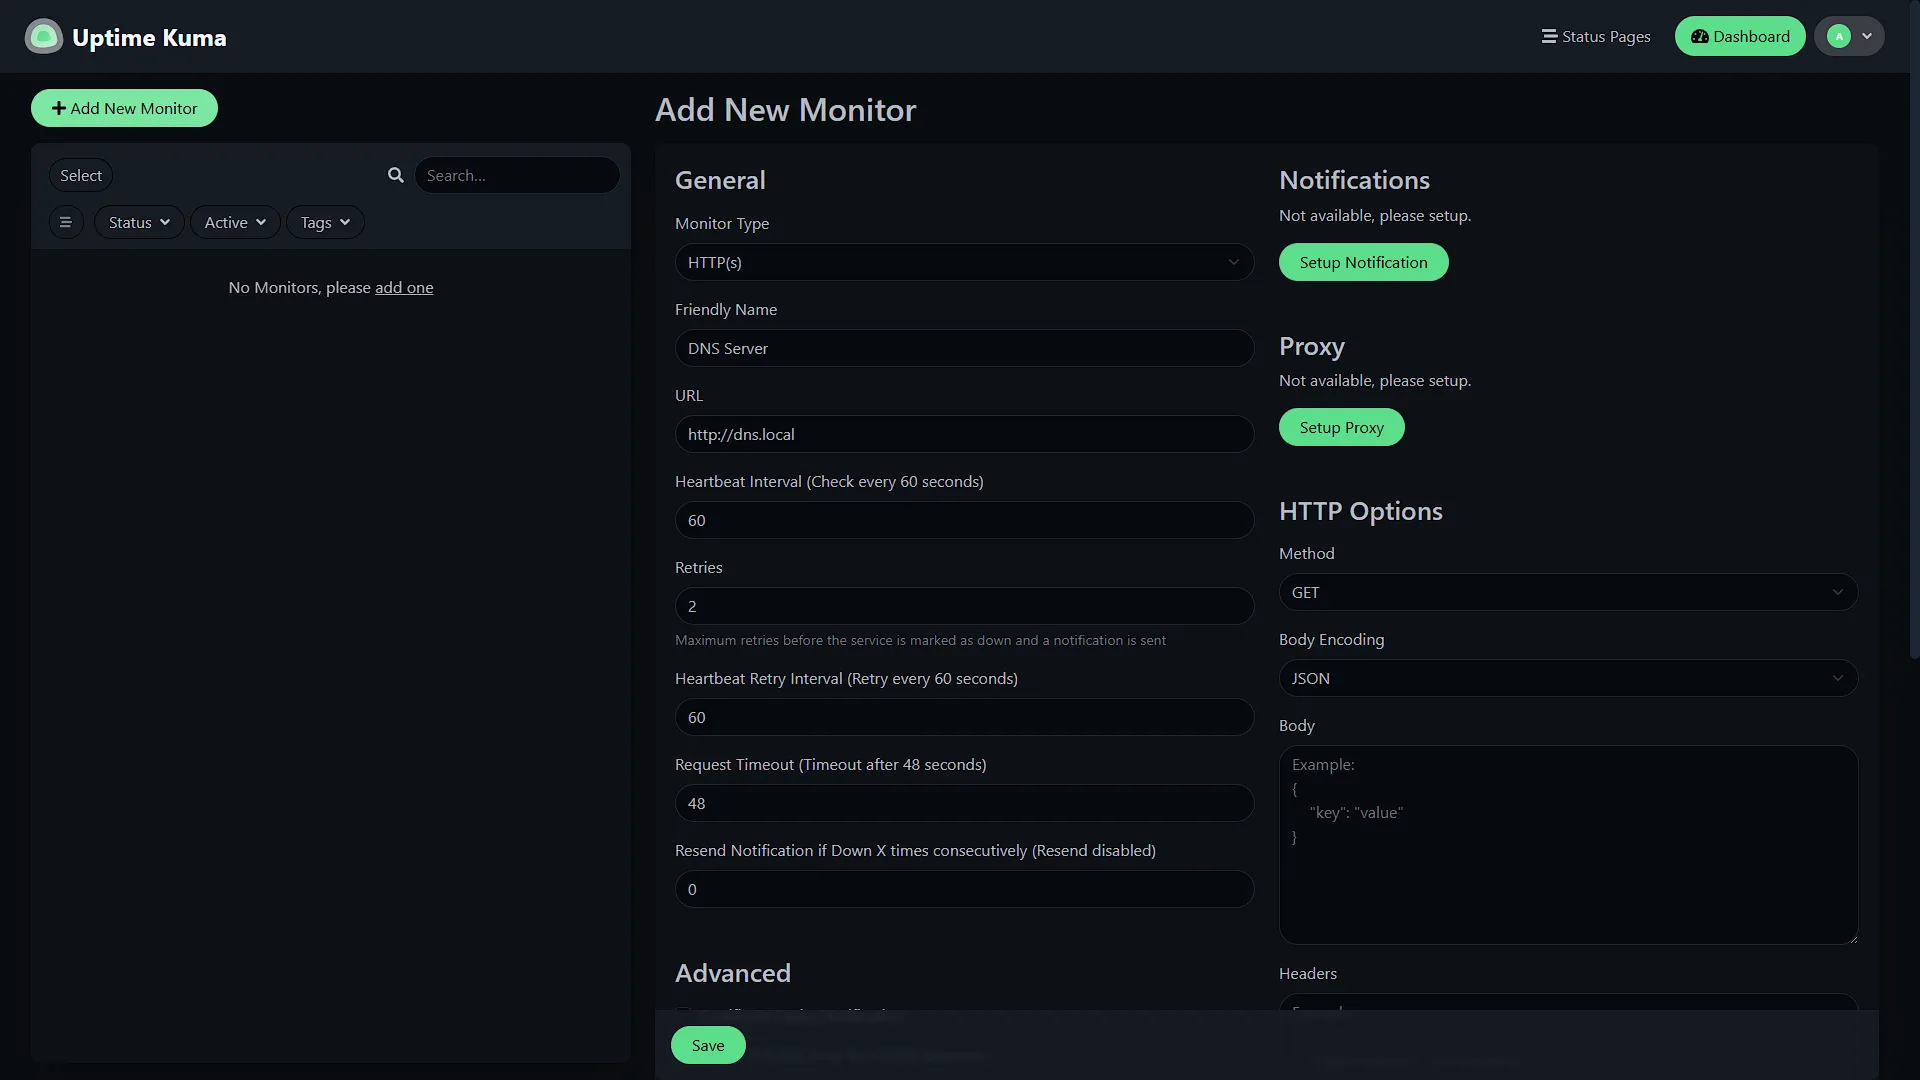
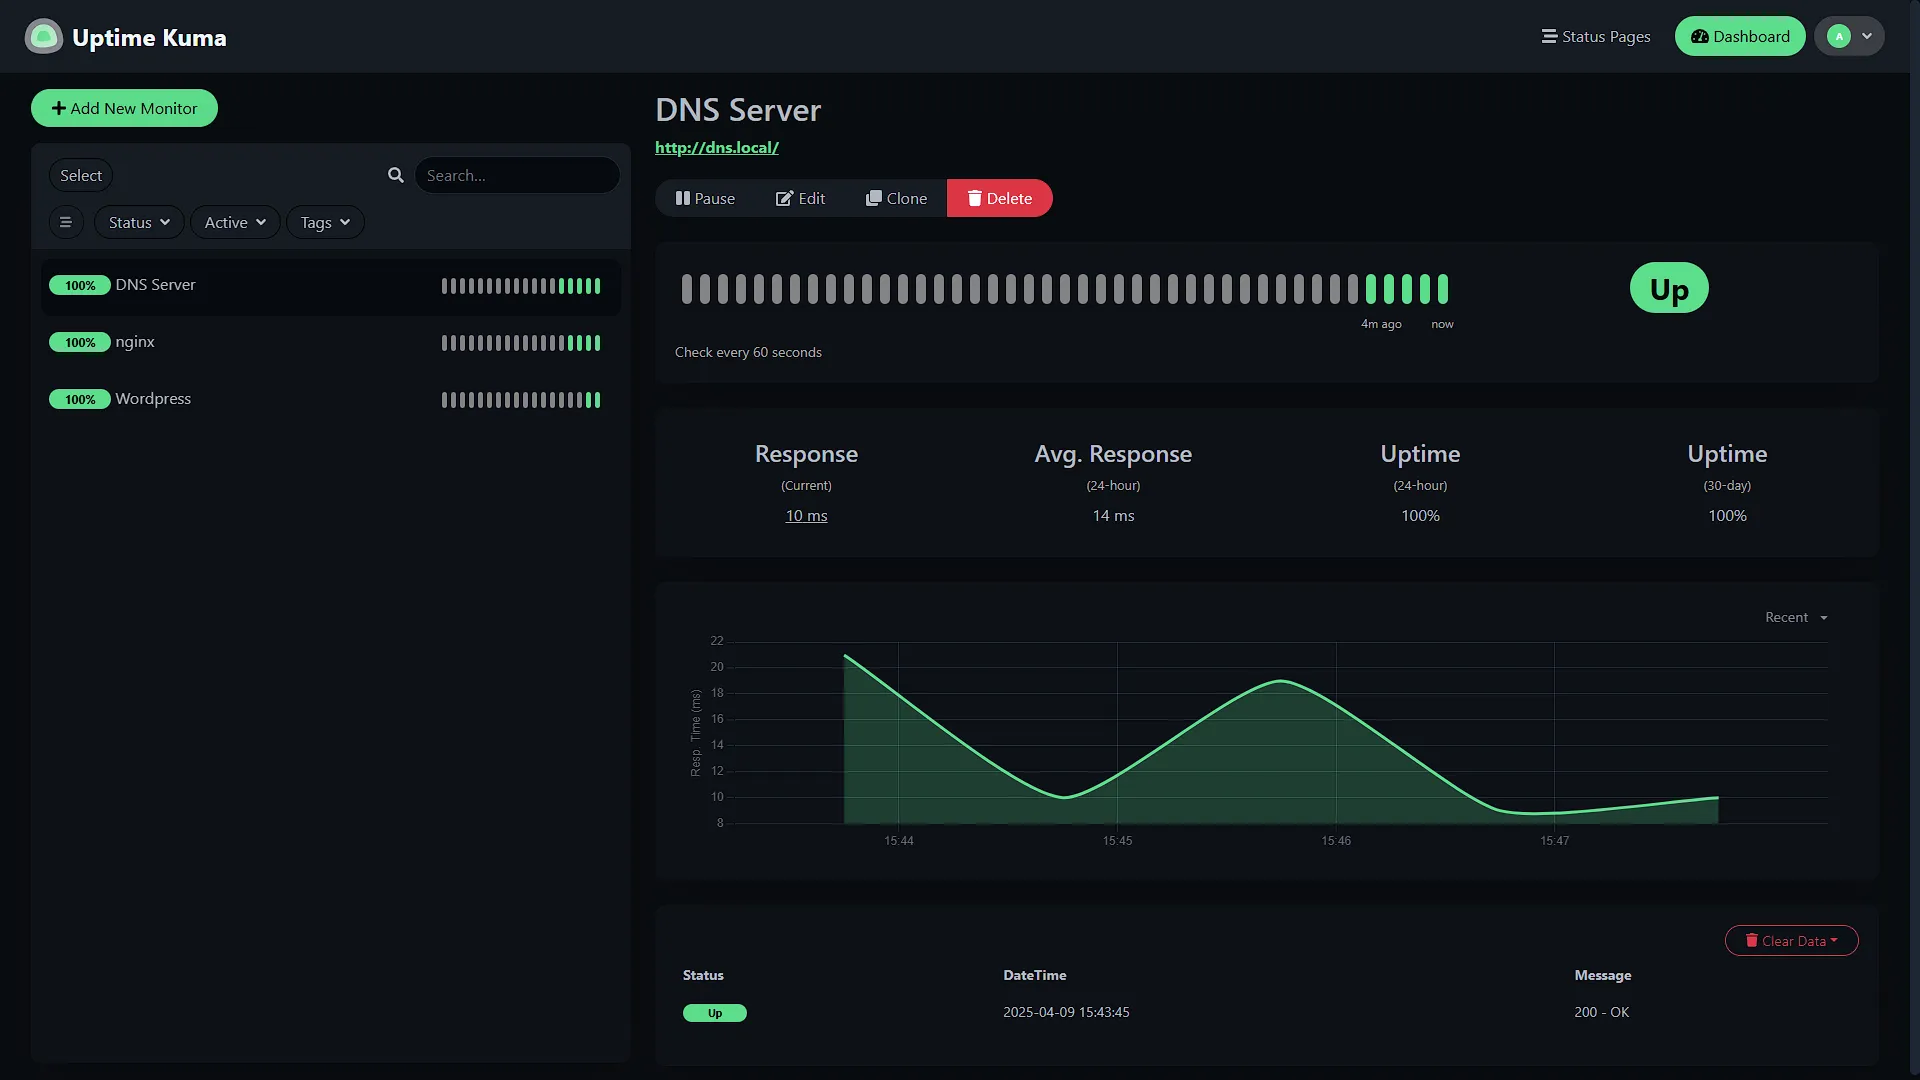
We can now access our Uptime Kuma from the URL we created when we installed Uptime Kuma. Once logged in, we can add a new monitor by clicking on the  button in the main window. To monitor our services, we are going to add three monitors (for now). Firstly, we want to monitor our DNS server. So we are going to select a monitor type of http(s) and add the address as
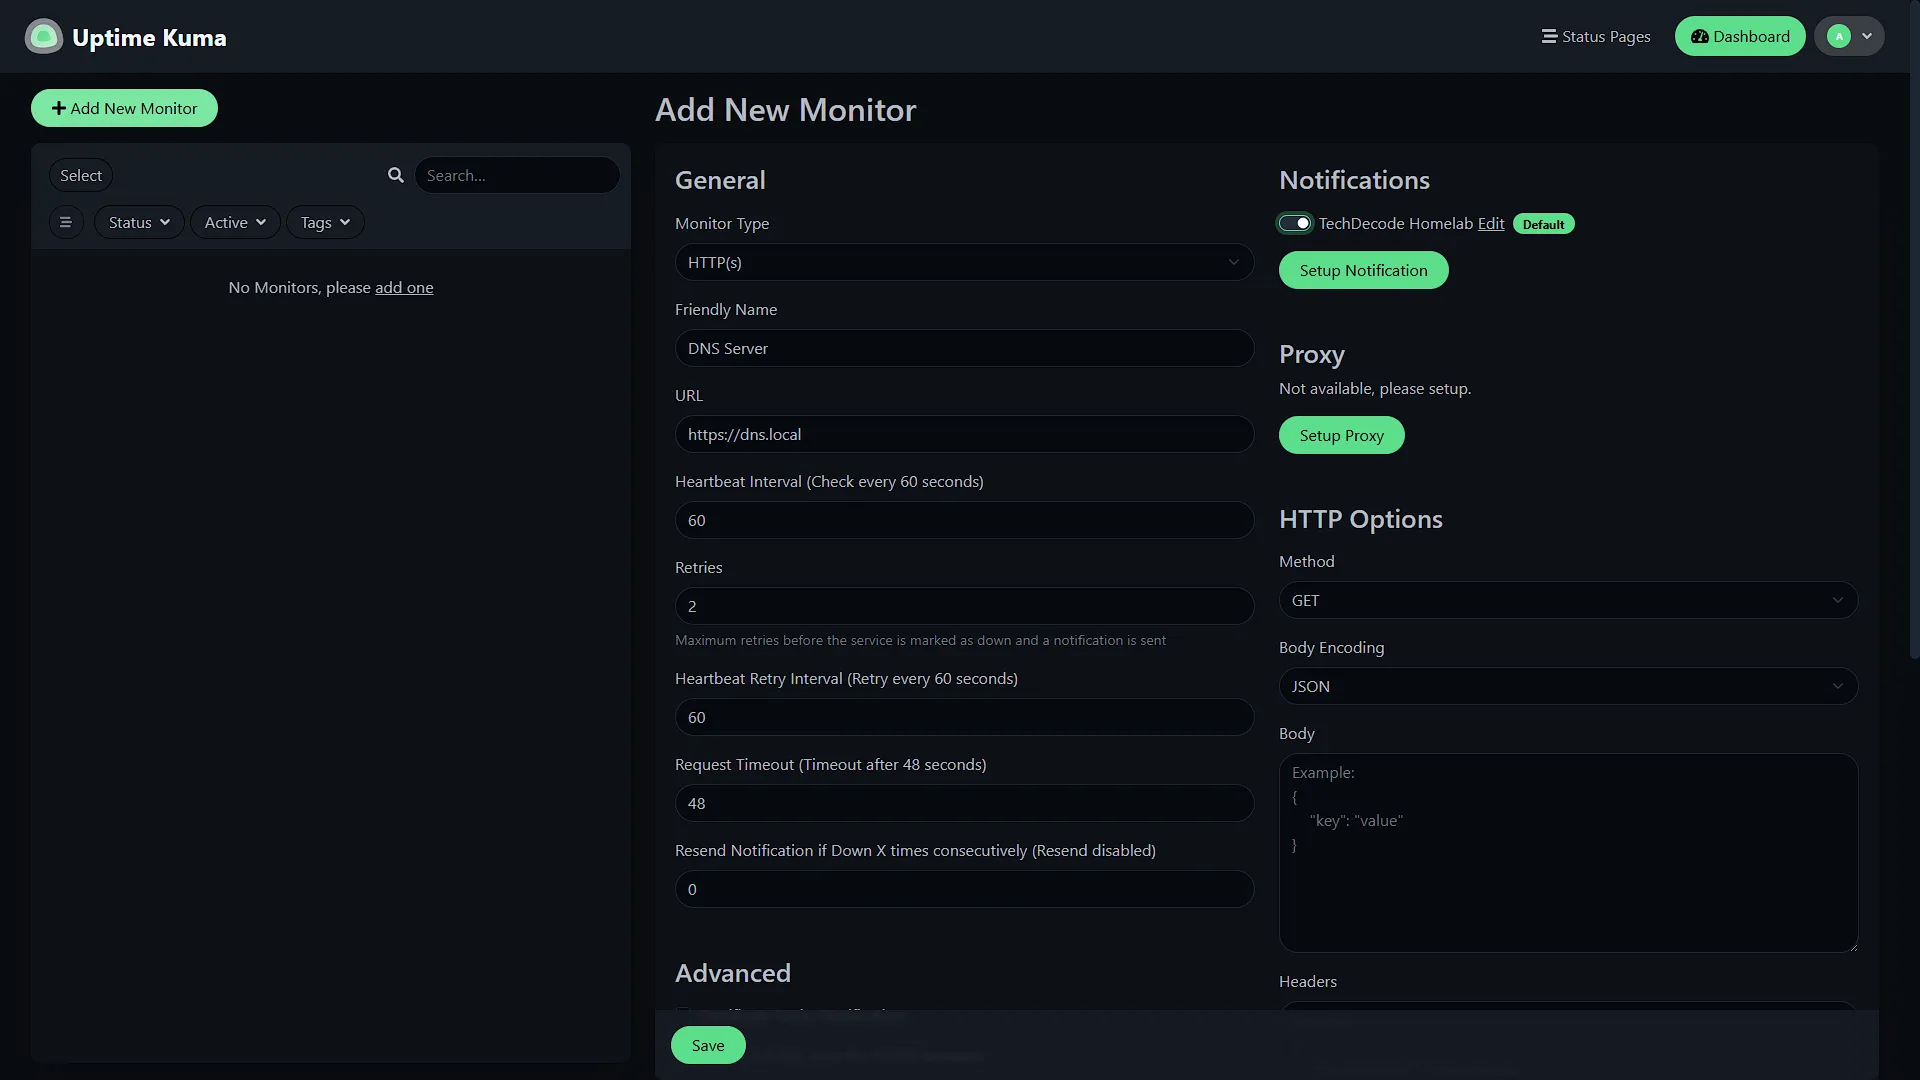
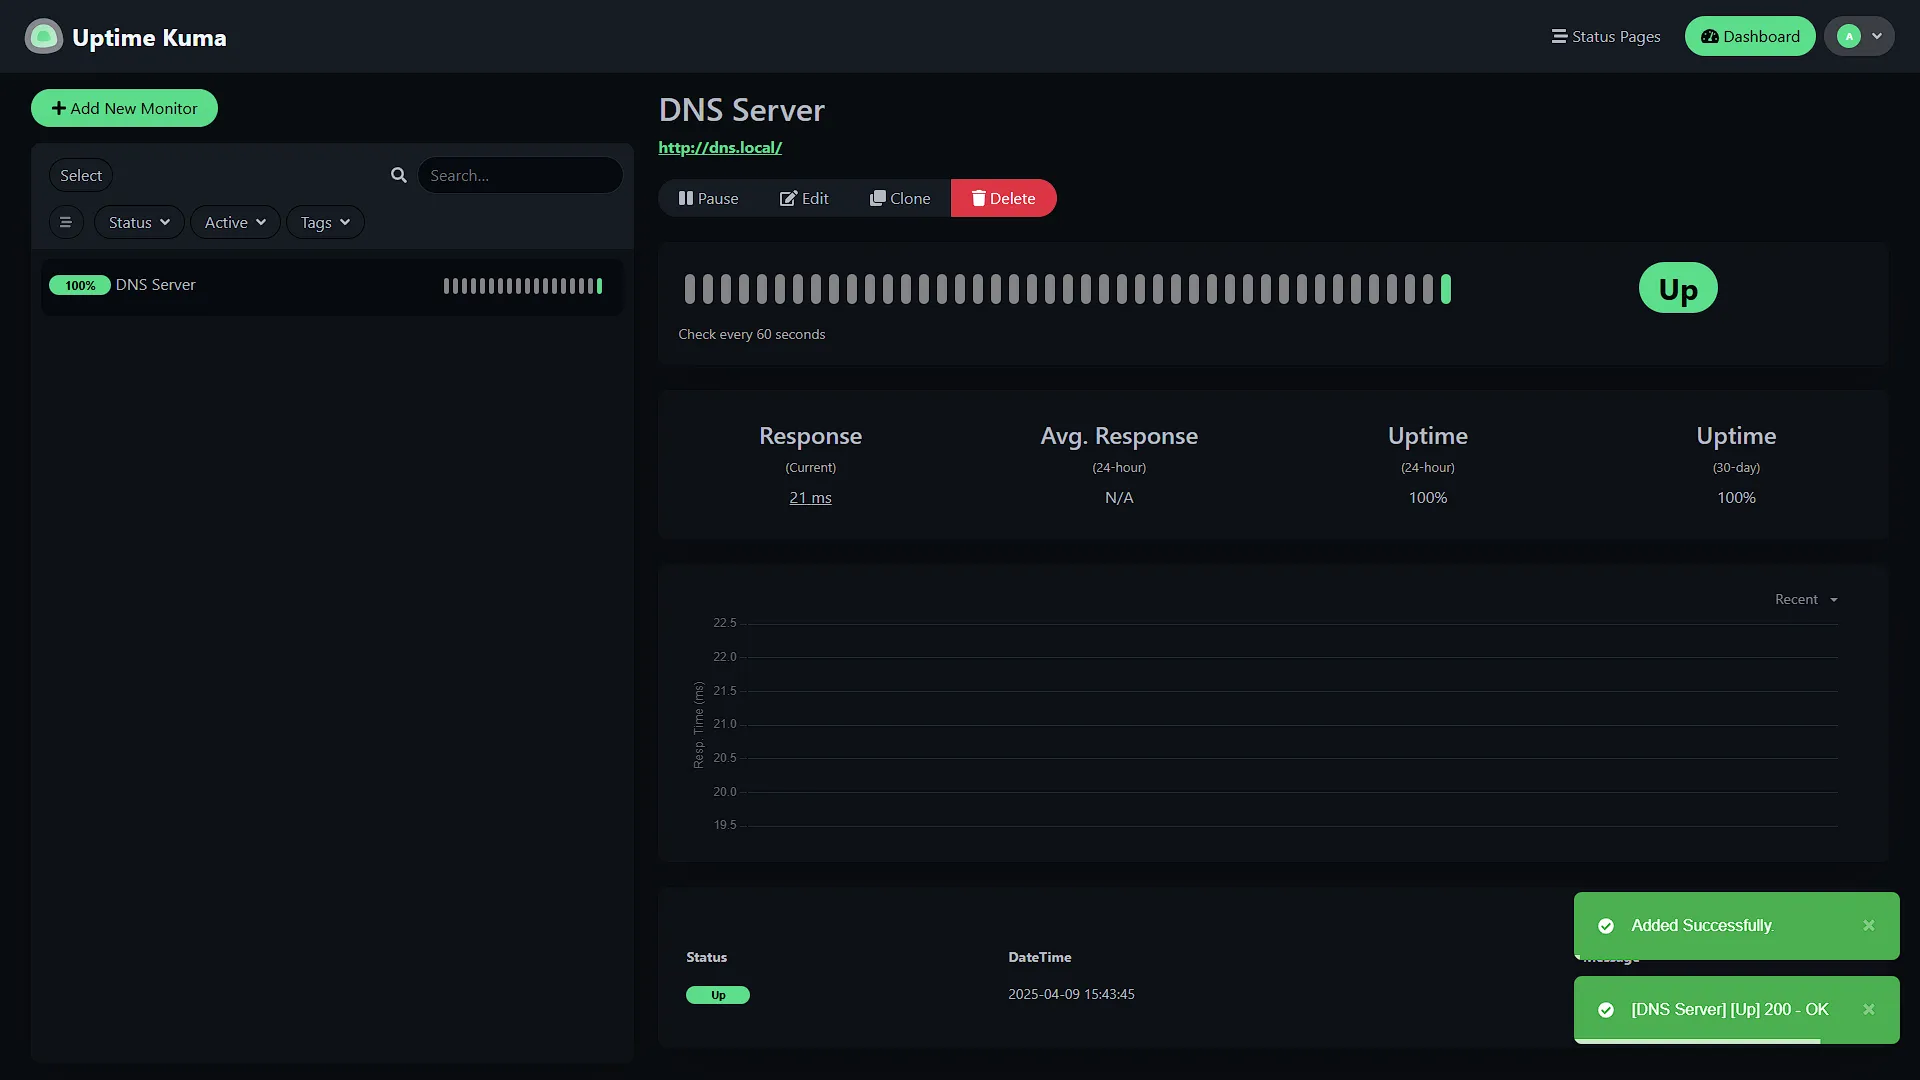
 http://dns.local as we have set it up. (you can also use the IP address if you prefer in the format http://xxx.xxx.xxx.xxx). we can change the number of retries before the service will be seen as DOWN as well as the timeout of a request and the interval that the service is going to be checked.
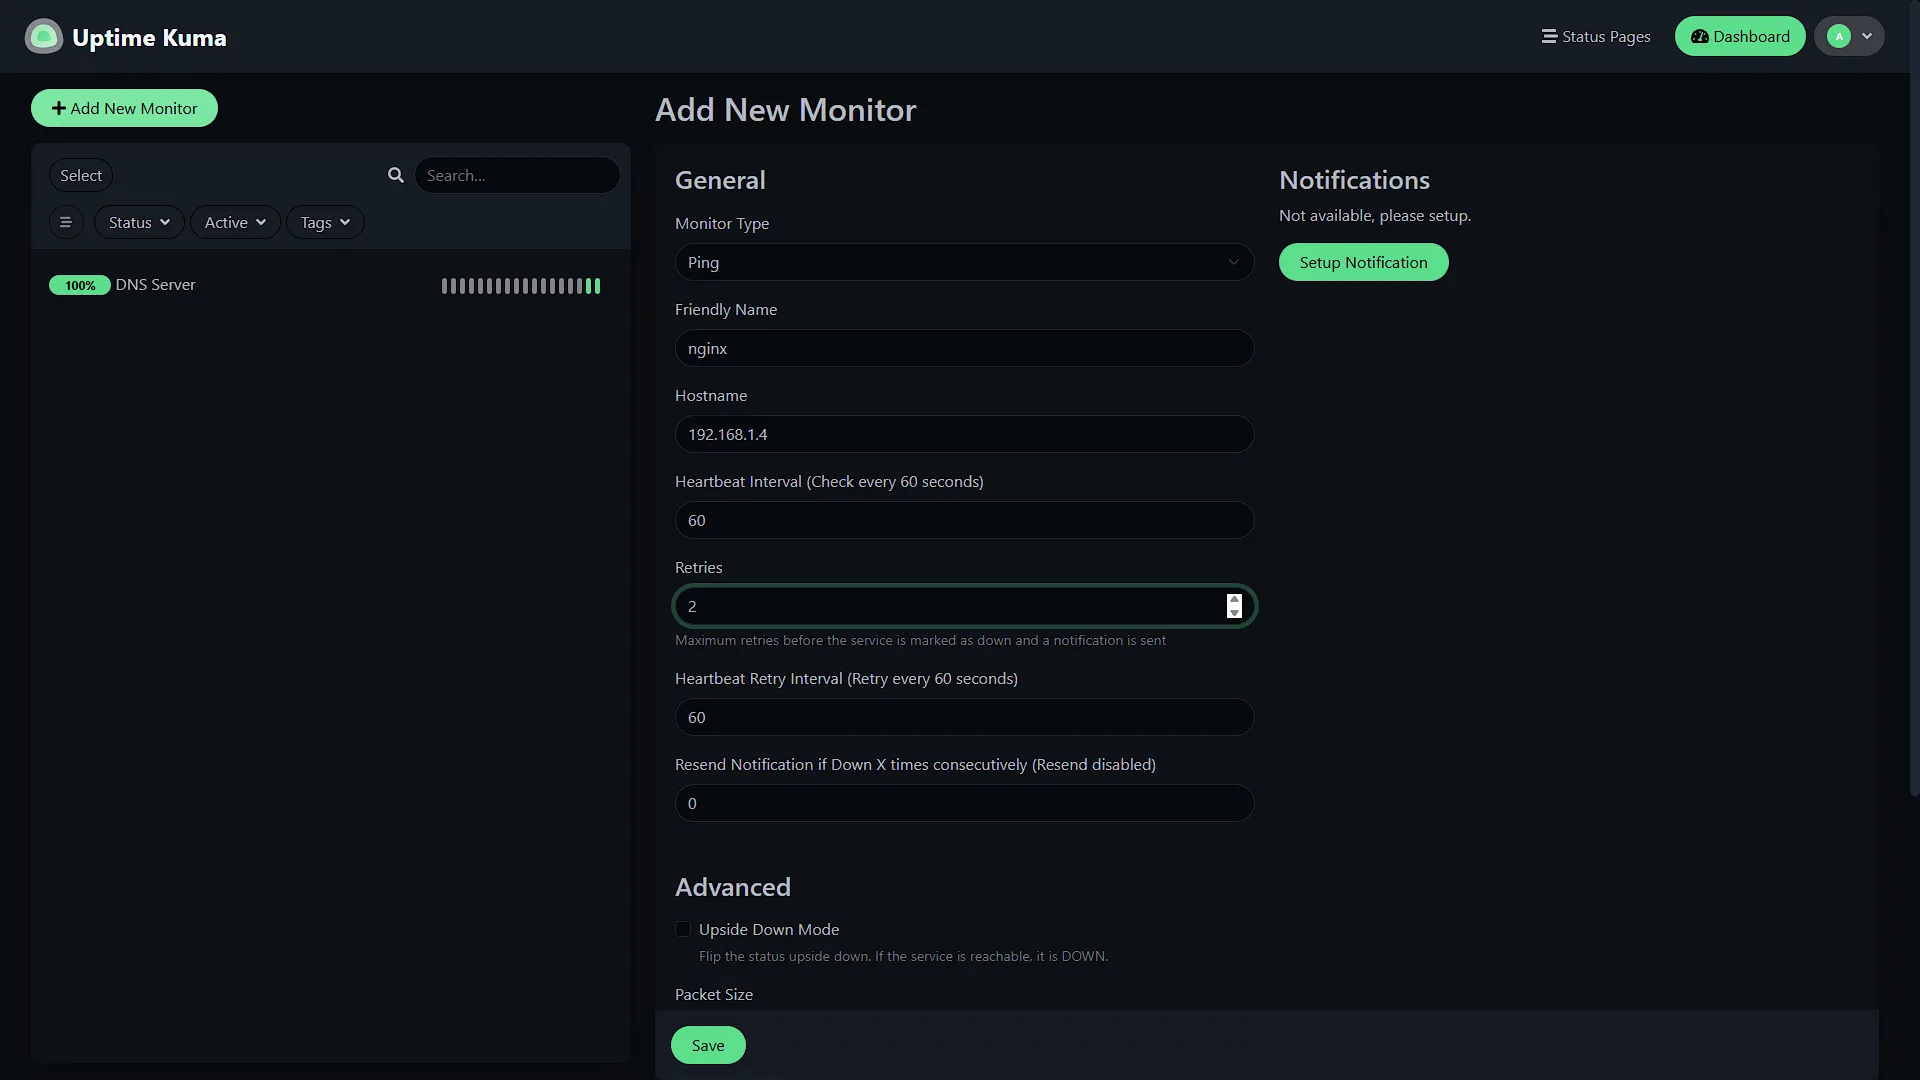
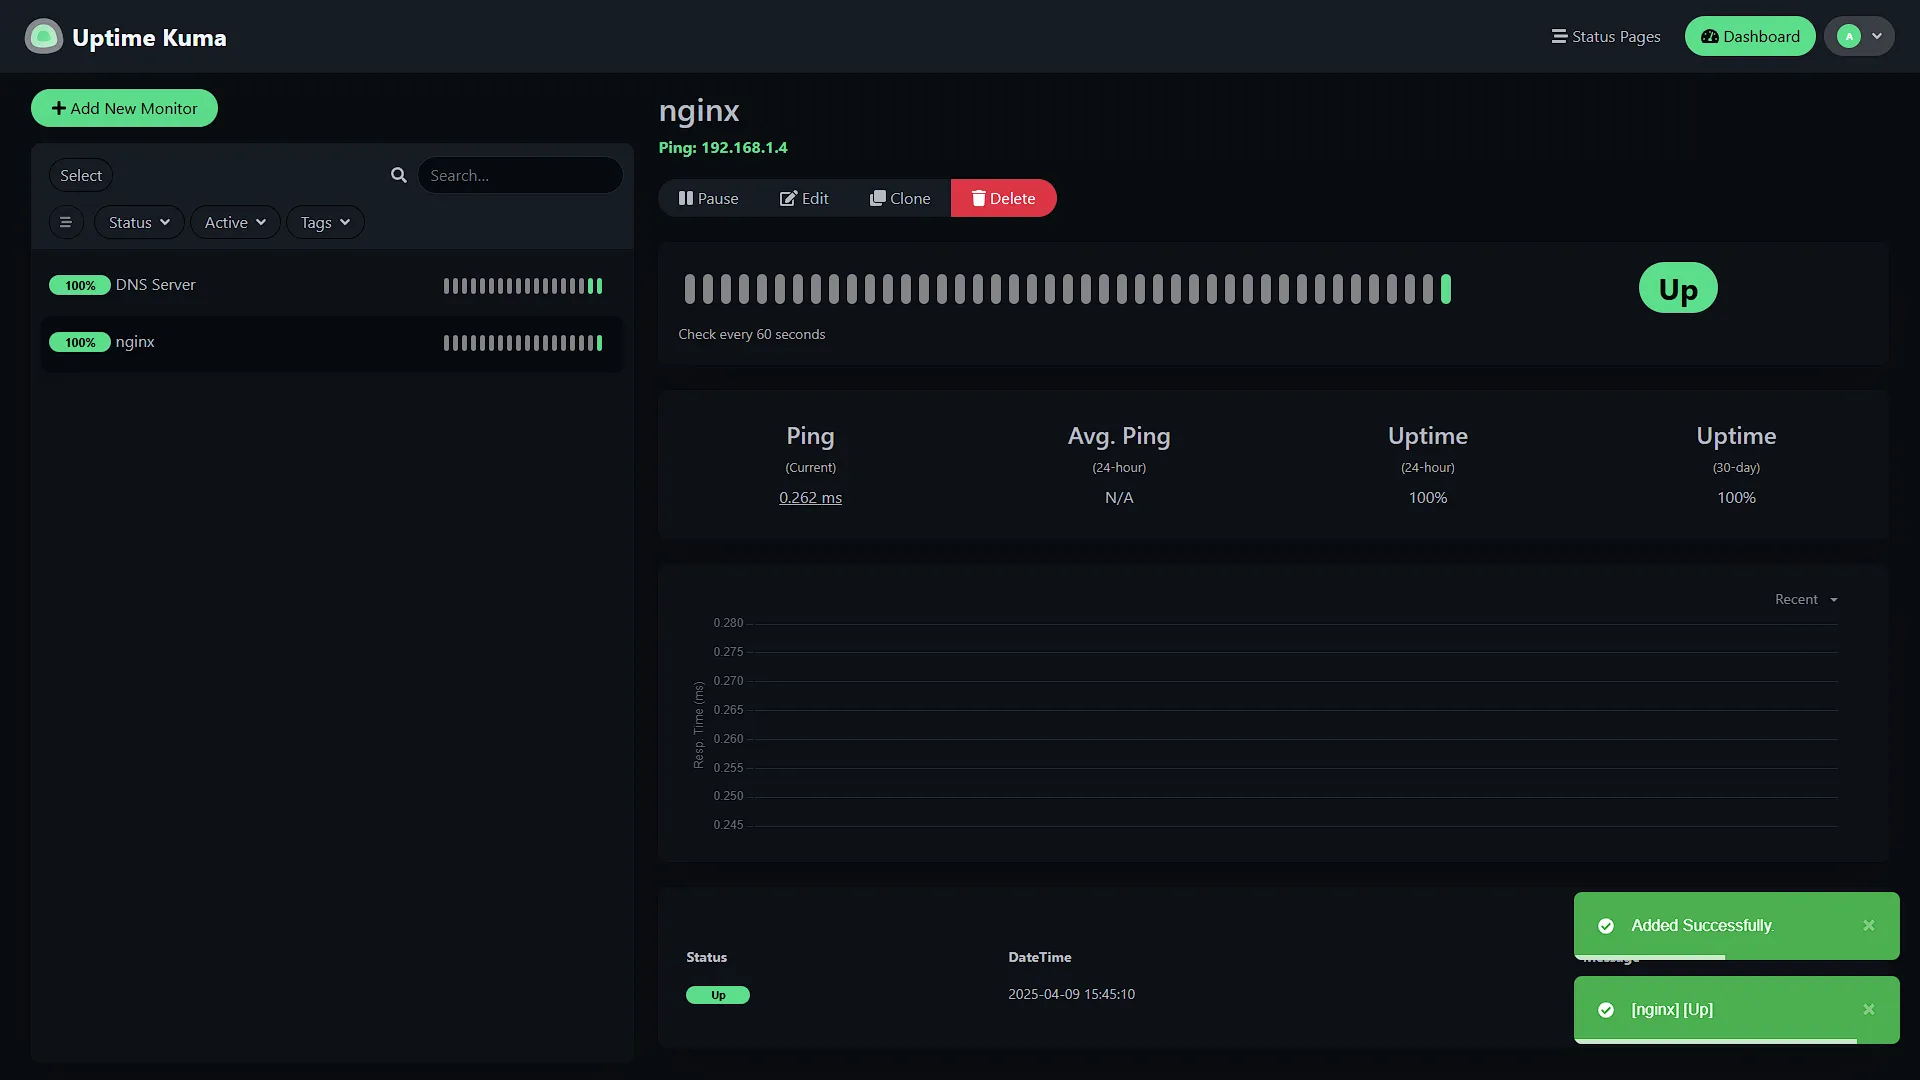
We also need to monitor our nginx server. This is a VM so we will add a monitor, this time of type Ping and add the IP address of the nginx server. We can again change the Retries etc values.
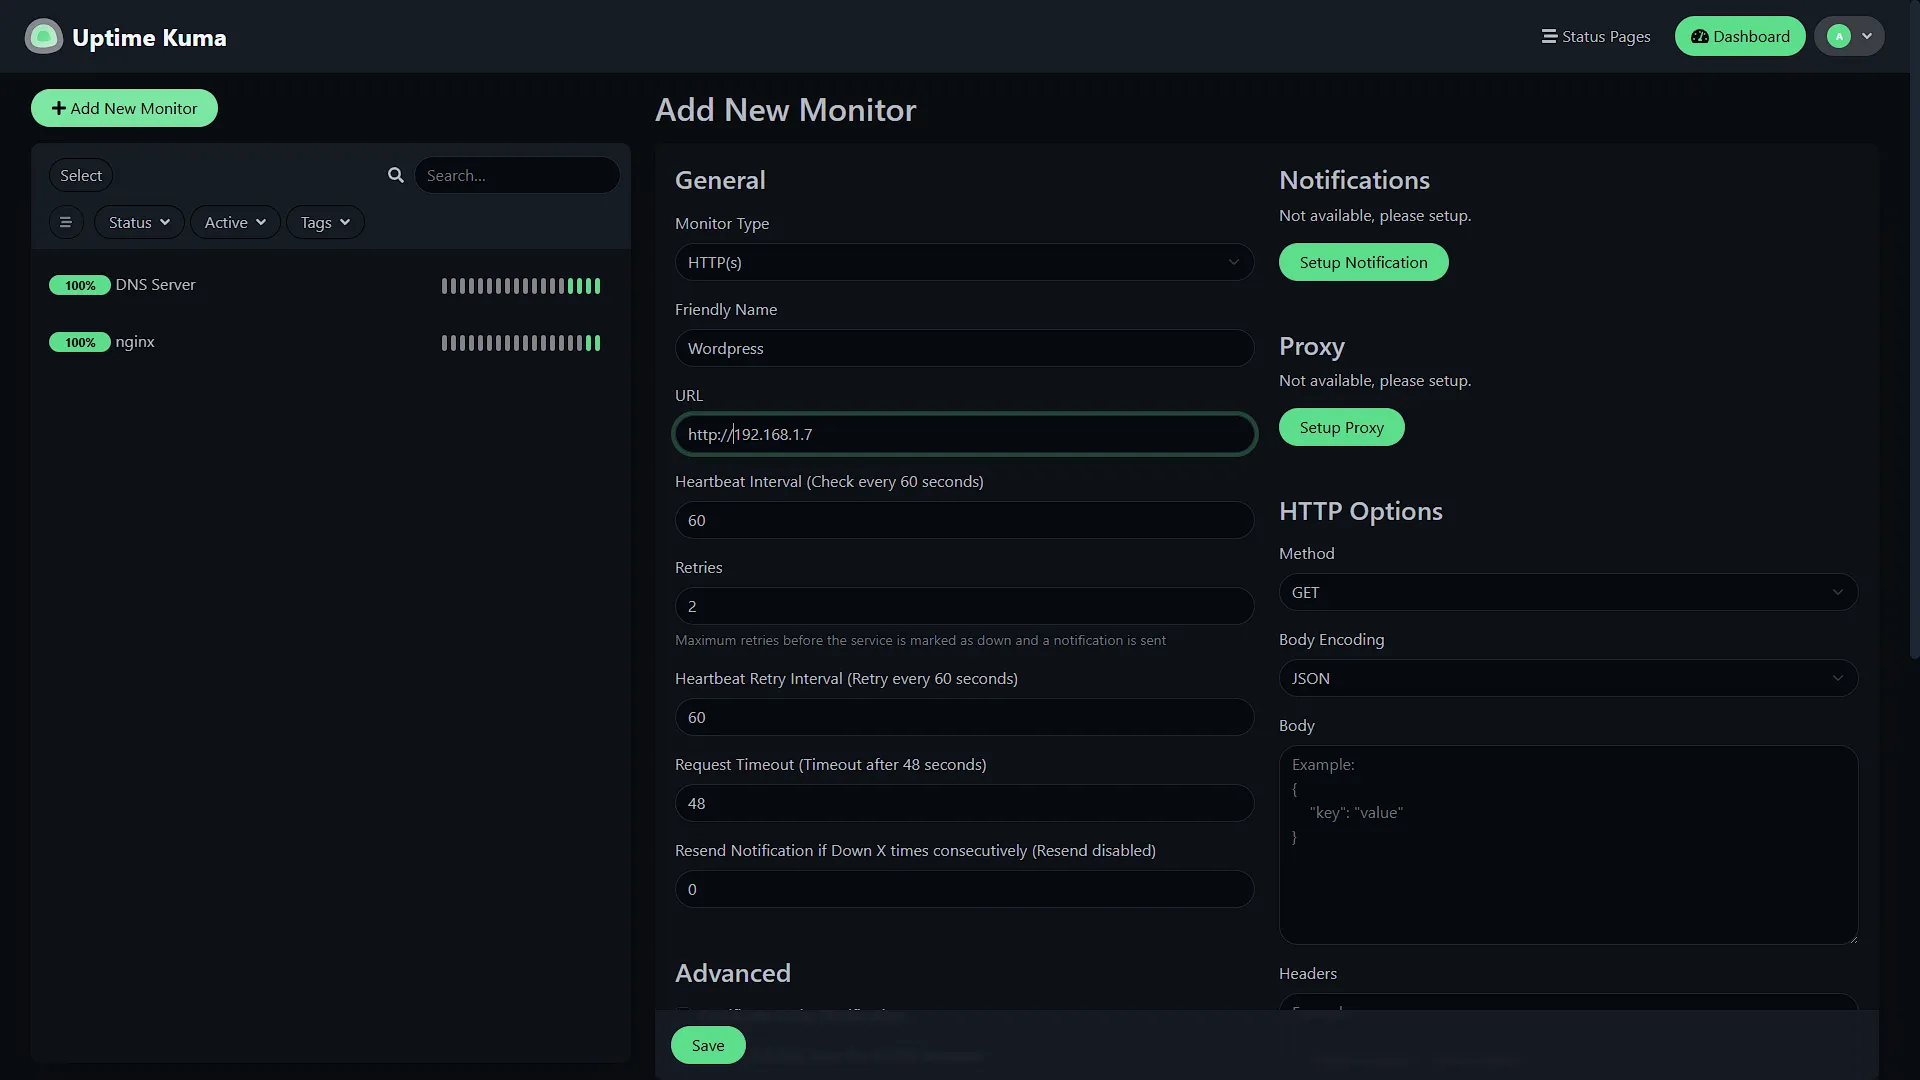
We also added a monitor for our Wordpress site, this time with the IP address on type http(s).
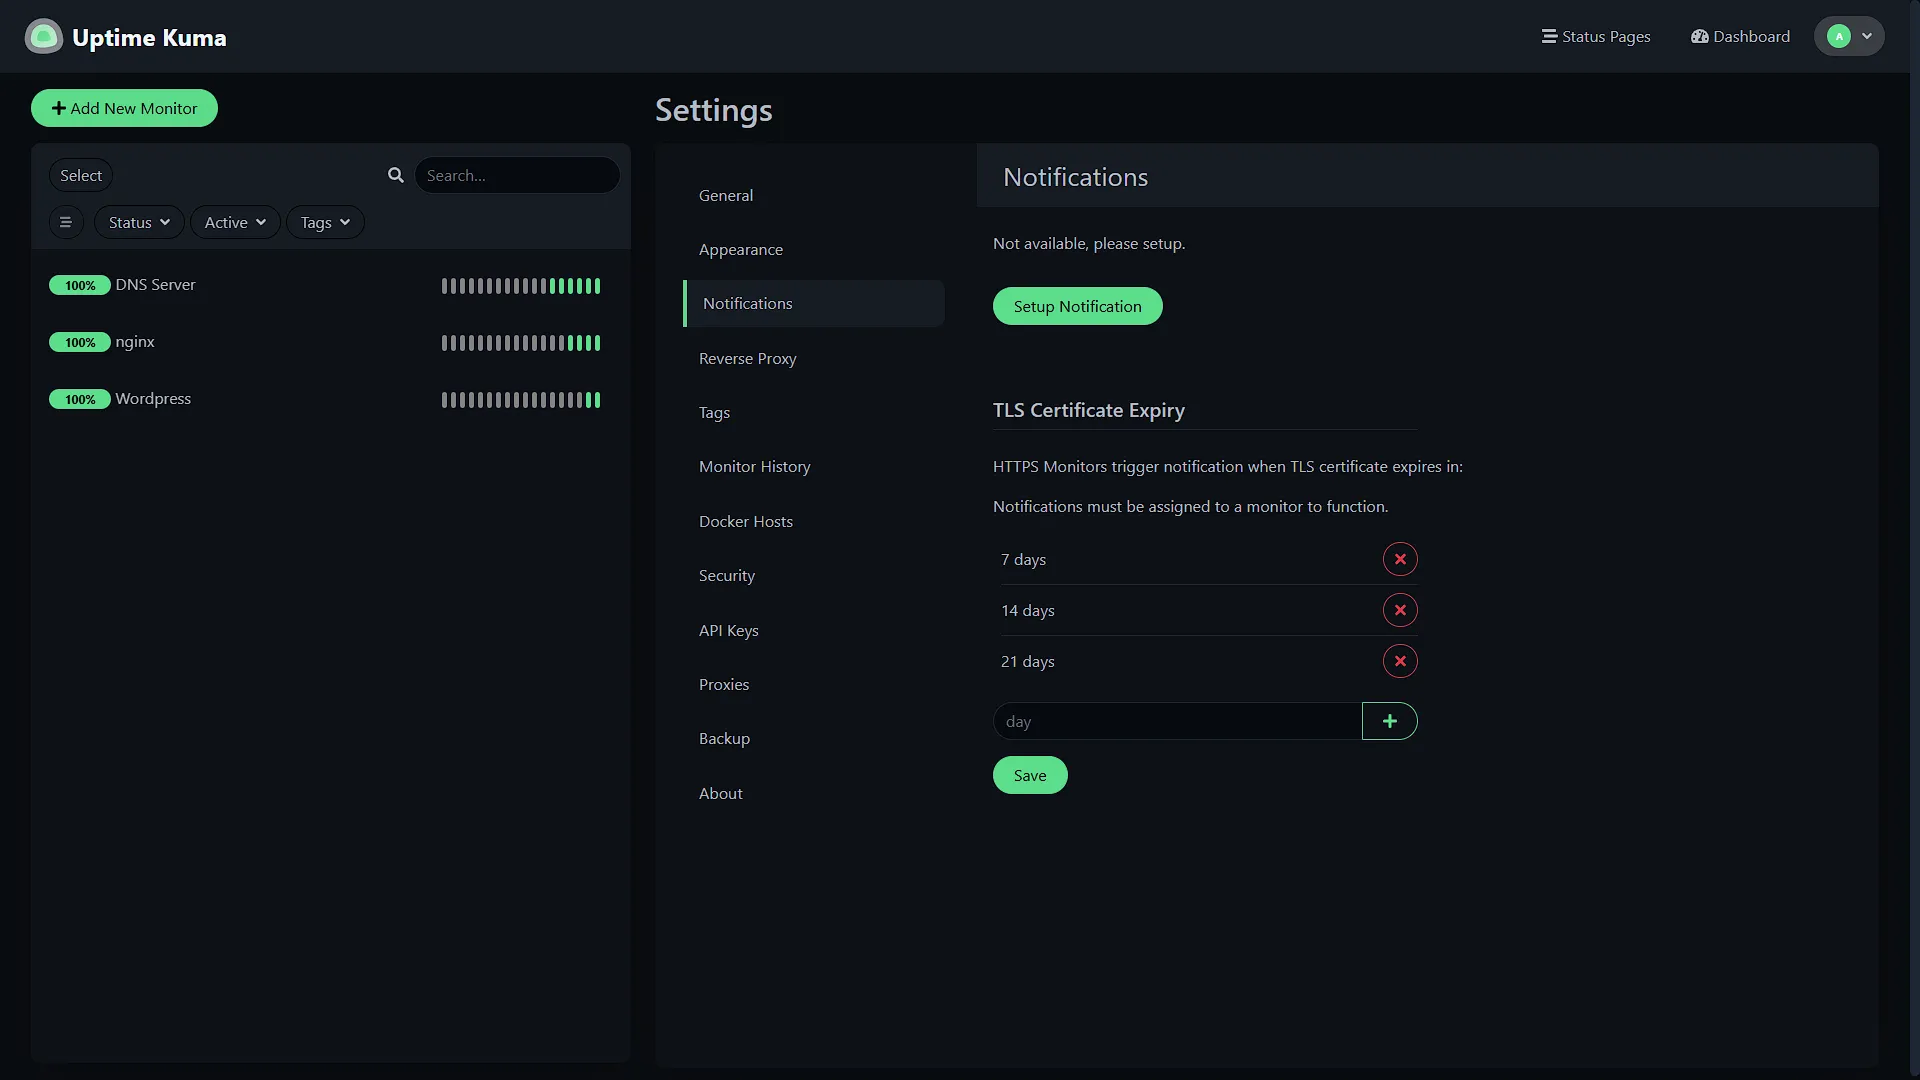
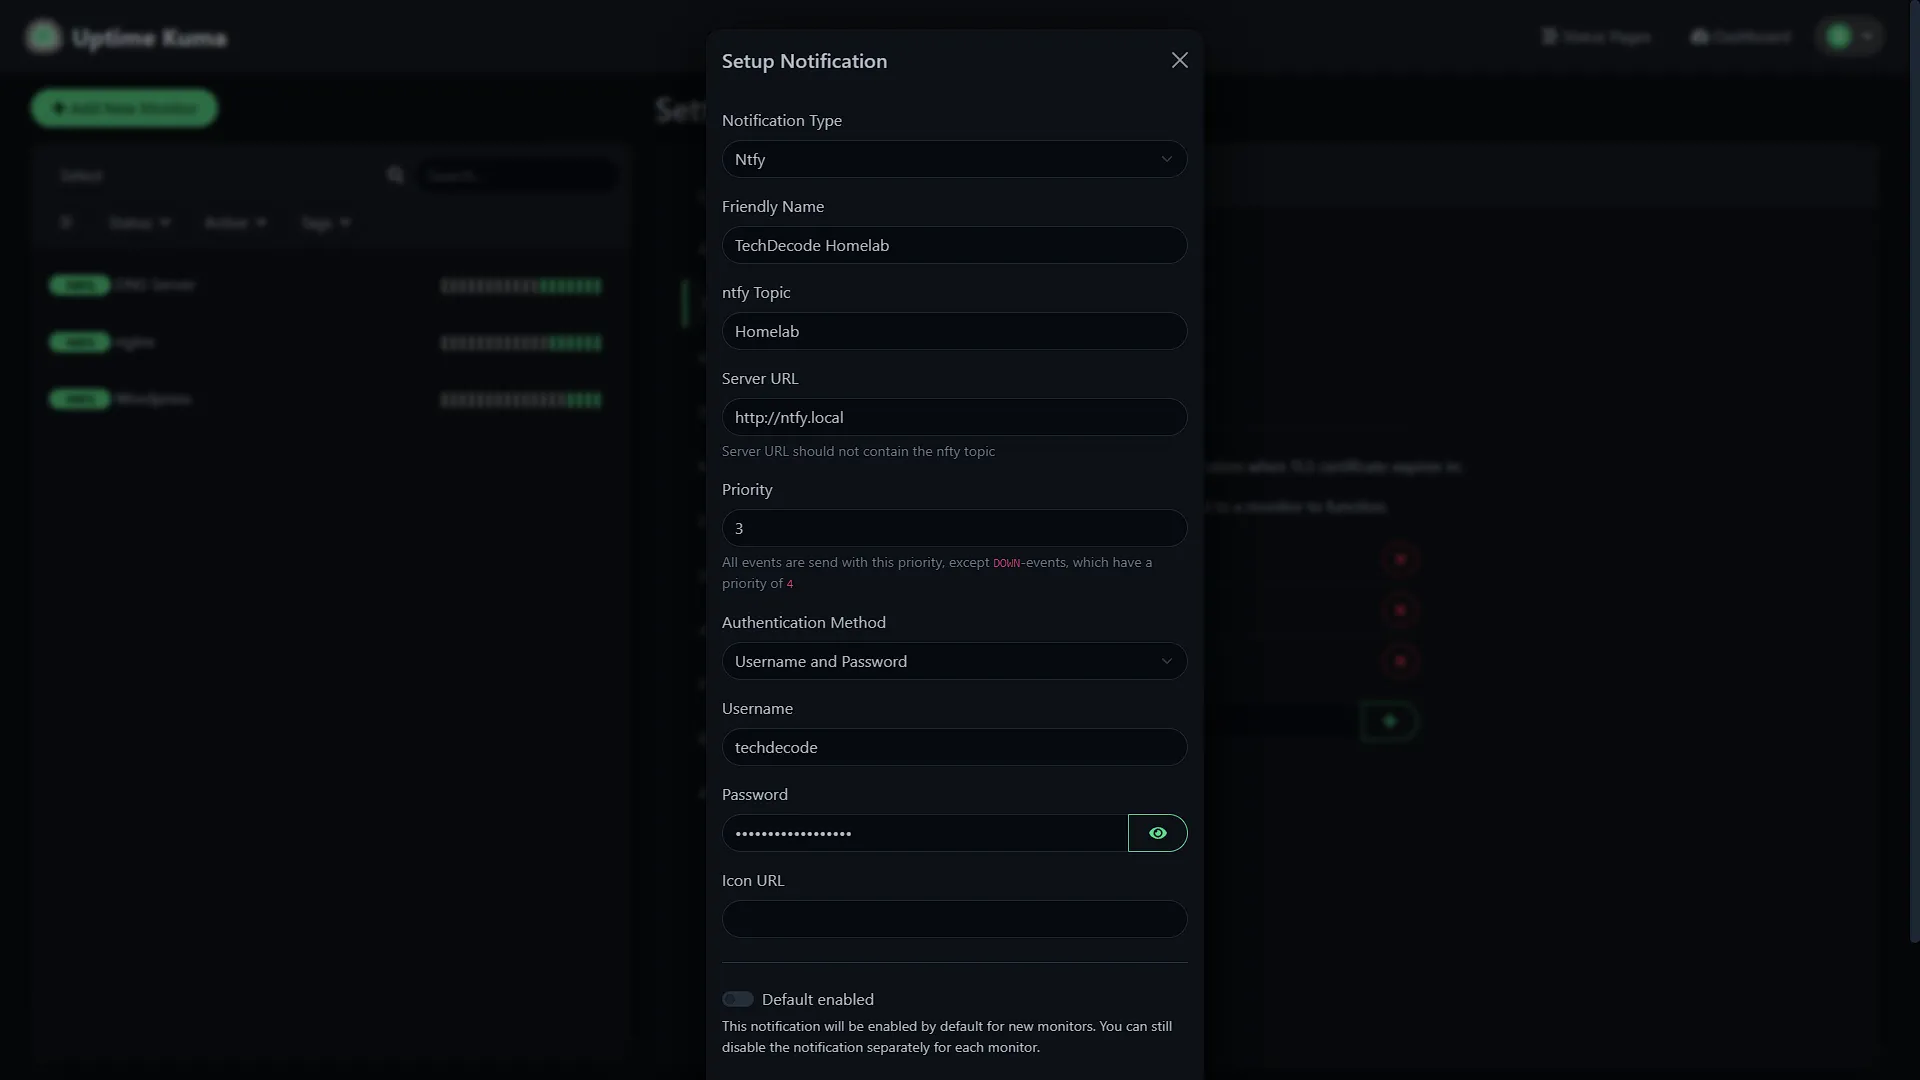
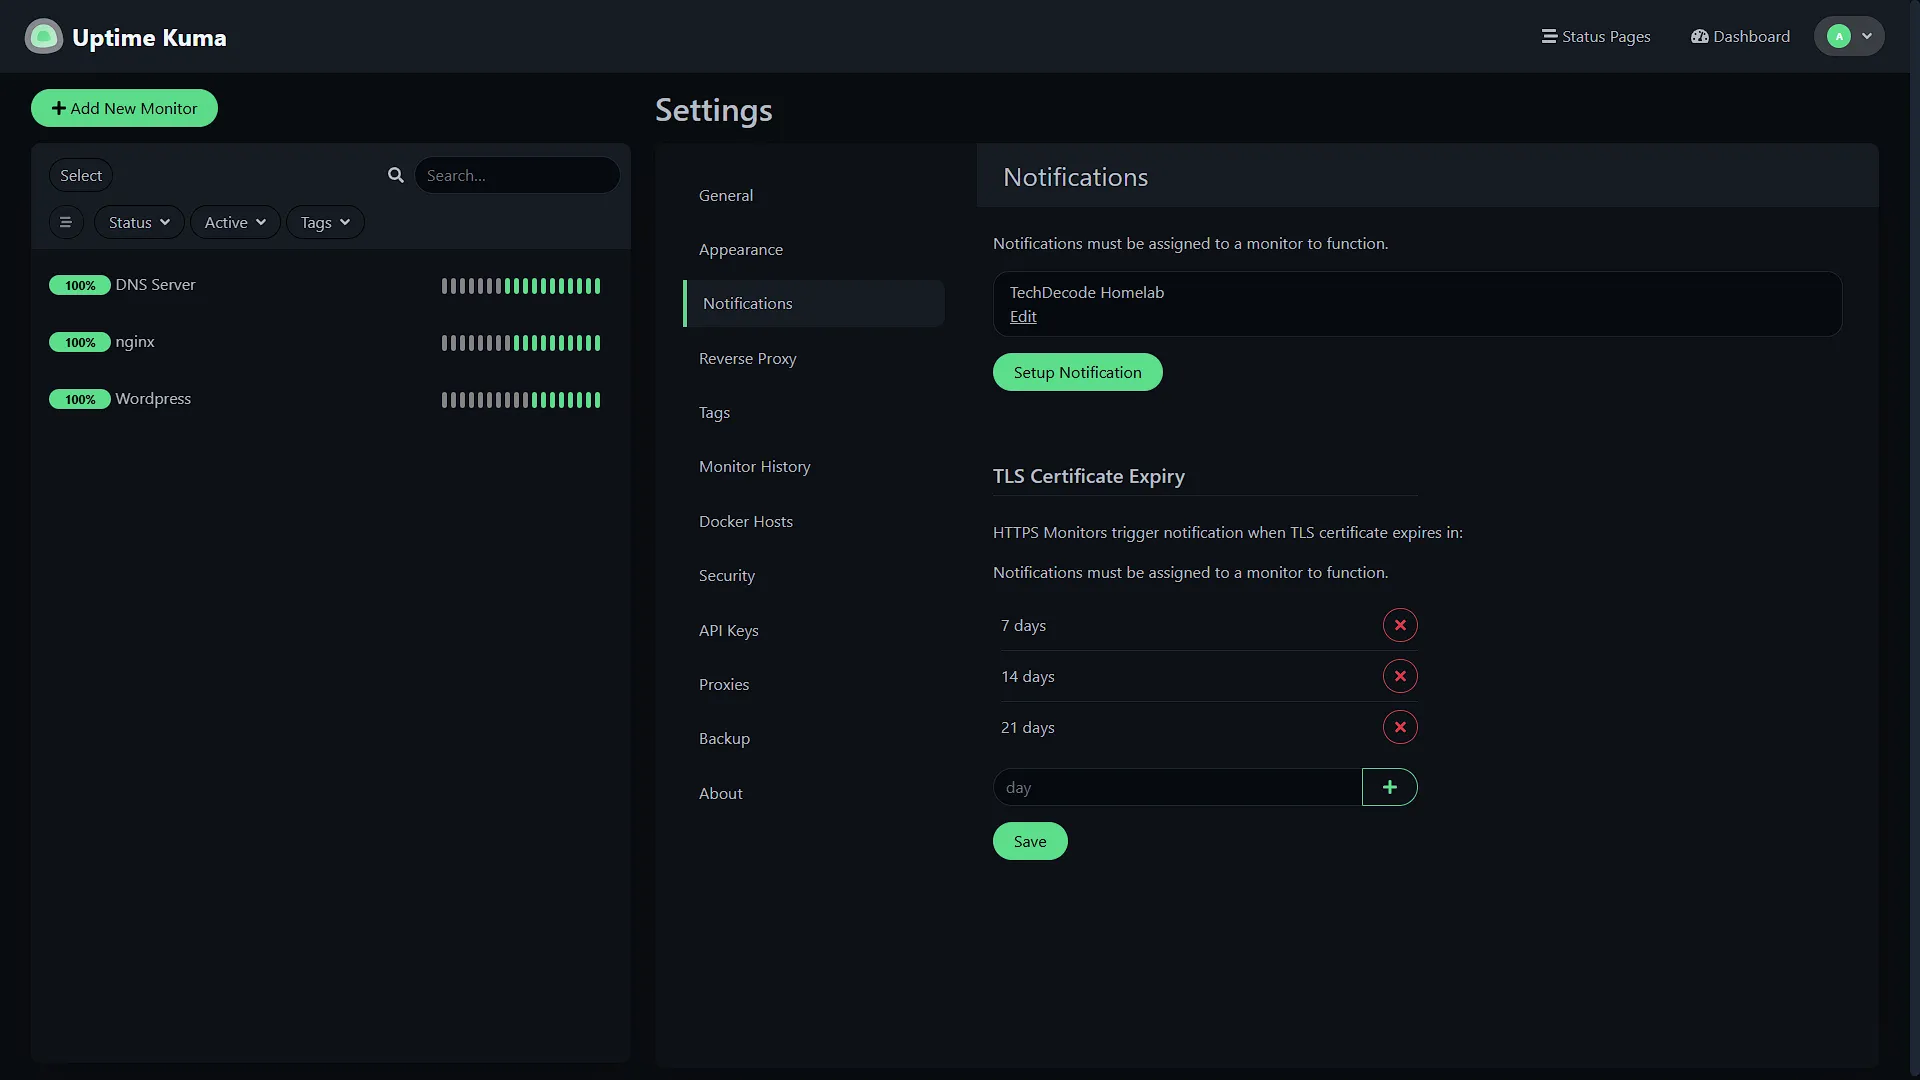
Once everything is added, we can add the Notifications. For this, go to Settings under your avatar menu in the top right. From here, select Notifications in the menu. Click the  button to add a new notification method. Enter the values:
Notification type - Select ntfy
Friendly Name - This can be anything used to identify this notification type.
ntfy Topic - Here we need to add the topic from step 2 and 3, so in our case Homelab
Server URL - This needs to point to the ntfy server. It can be an IP address or the URL if you have one set up in your DNS. We set up ntfy.local to point to our ntfy instance, so we are using that. You can also use the URL used to access ntfy from outside the home network, in our case techdecode.tplinkdns.com.
Priority - Can be anything as the default for a service going down will be 4.
Authentication method - Select username and password so that we can enter the credentials to access the topic.
Username - Enter the username that got access details in step 1
Password - Enter the password for said user
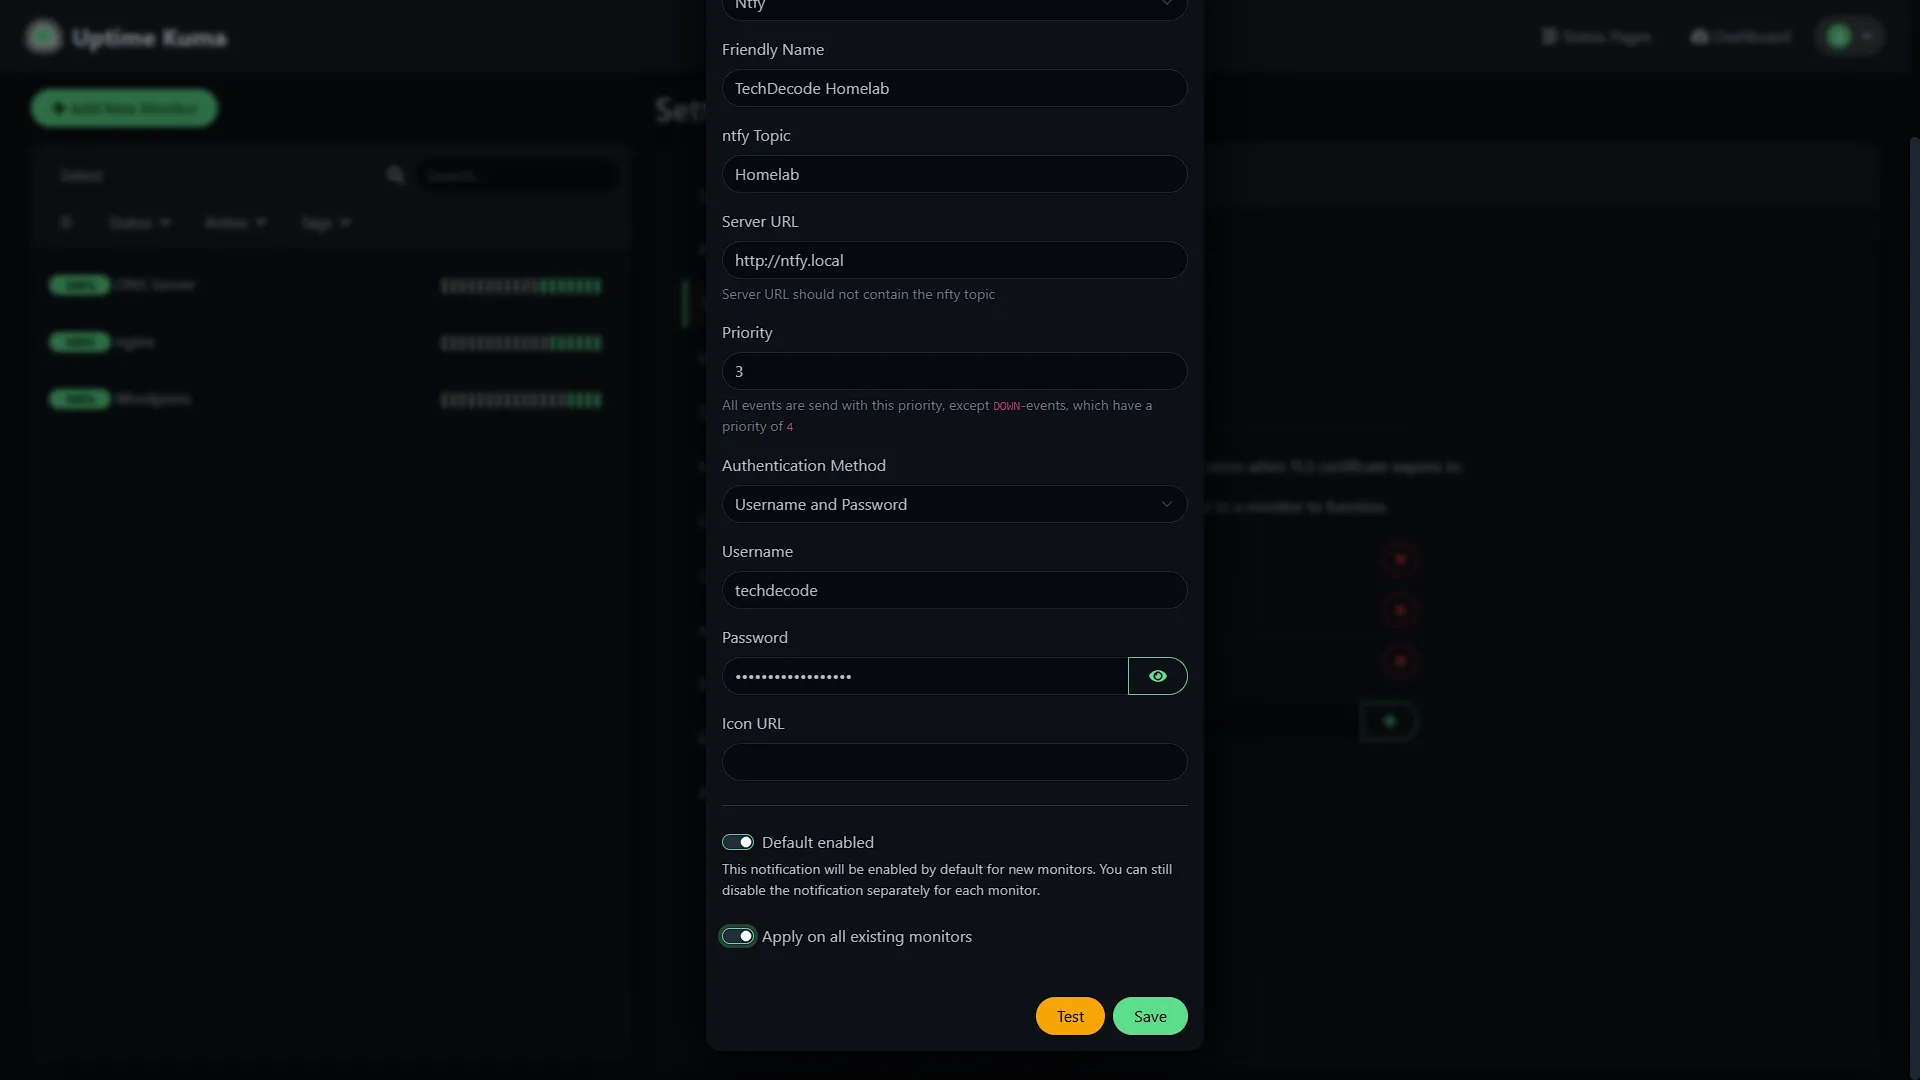
Default Enabled - Select this if you want this notification method to be the default for newly created monitors.
Apply to all existing monitors - Select this if you want this notification to be added to all existing monitors, which is what we want to do
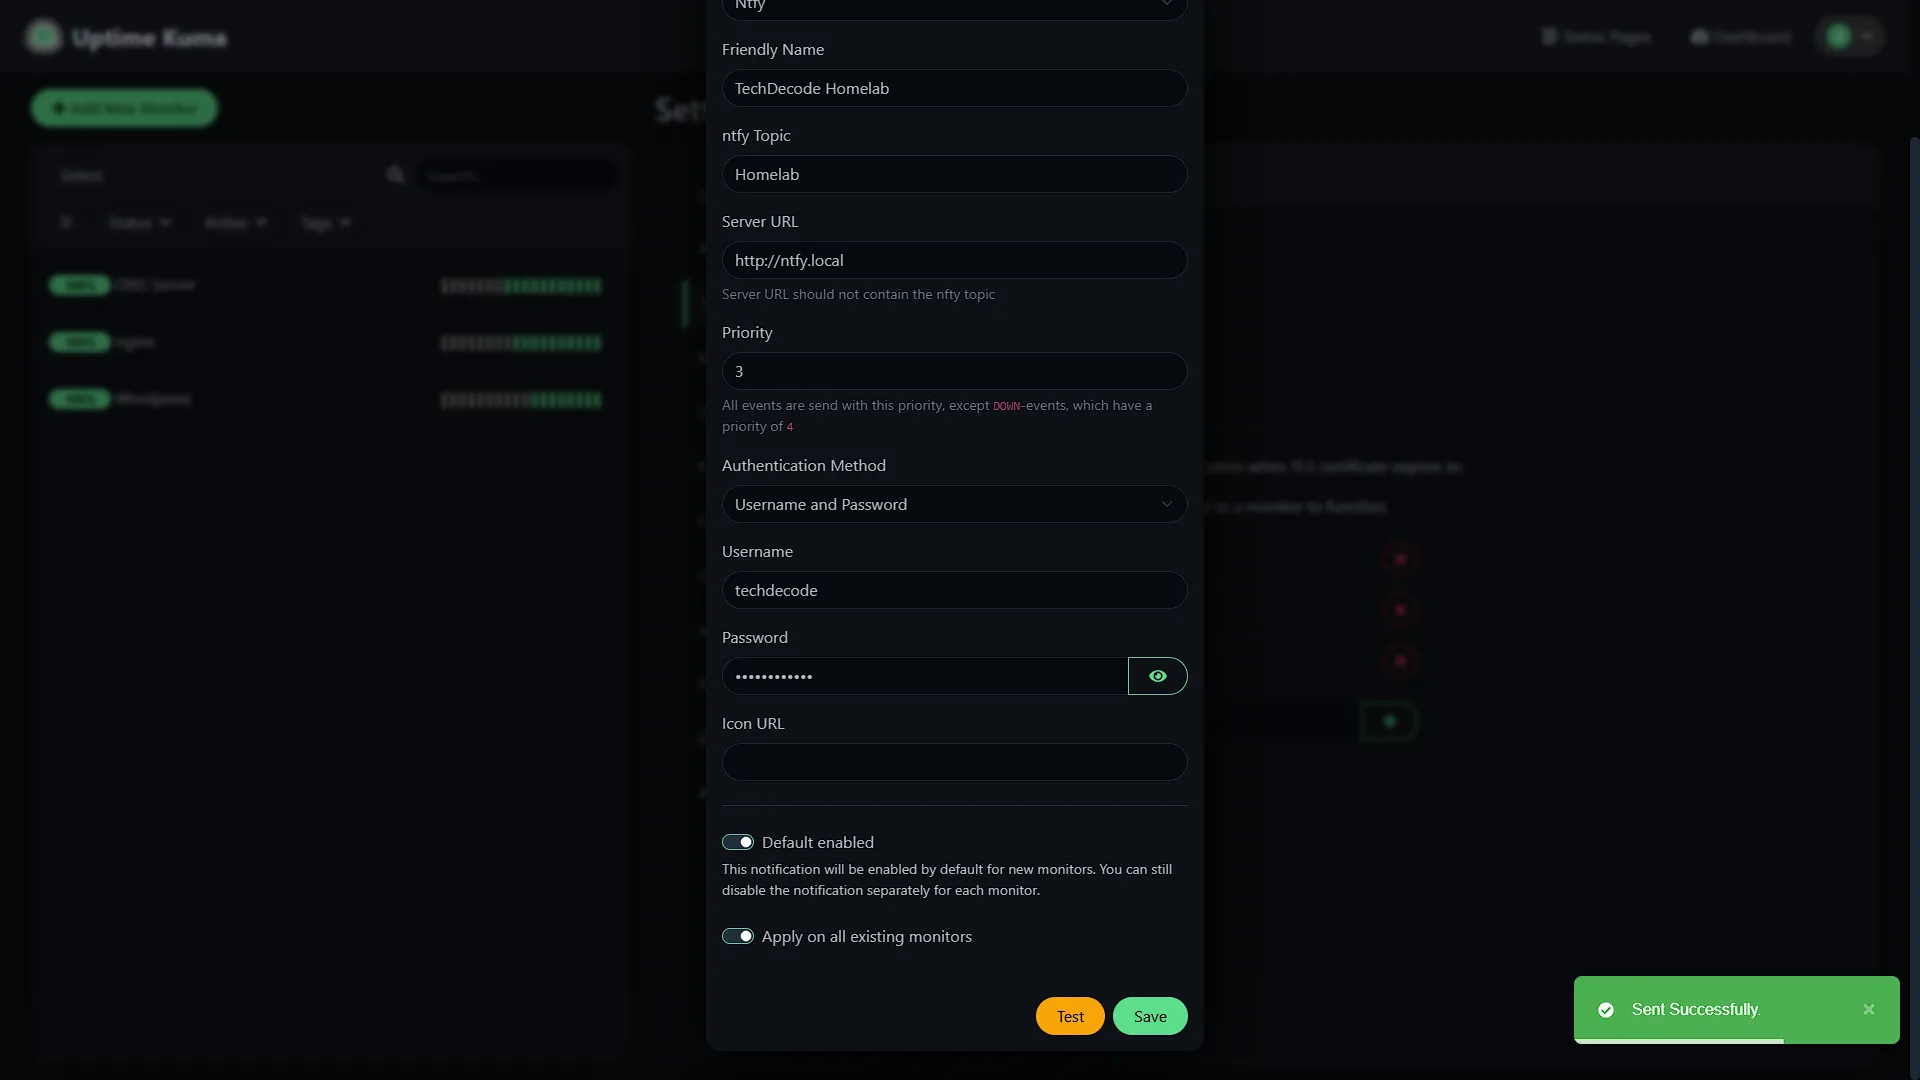
Now that we have everything filled in, we can test the connection. If the test succeeds, we will receive the test notification on our phone
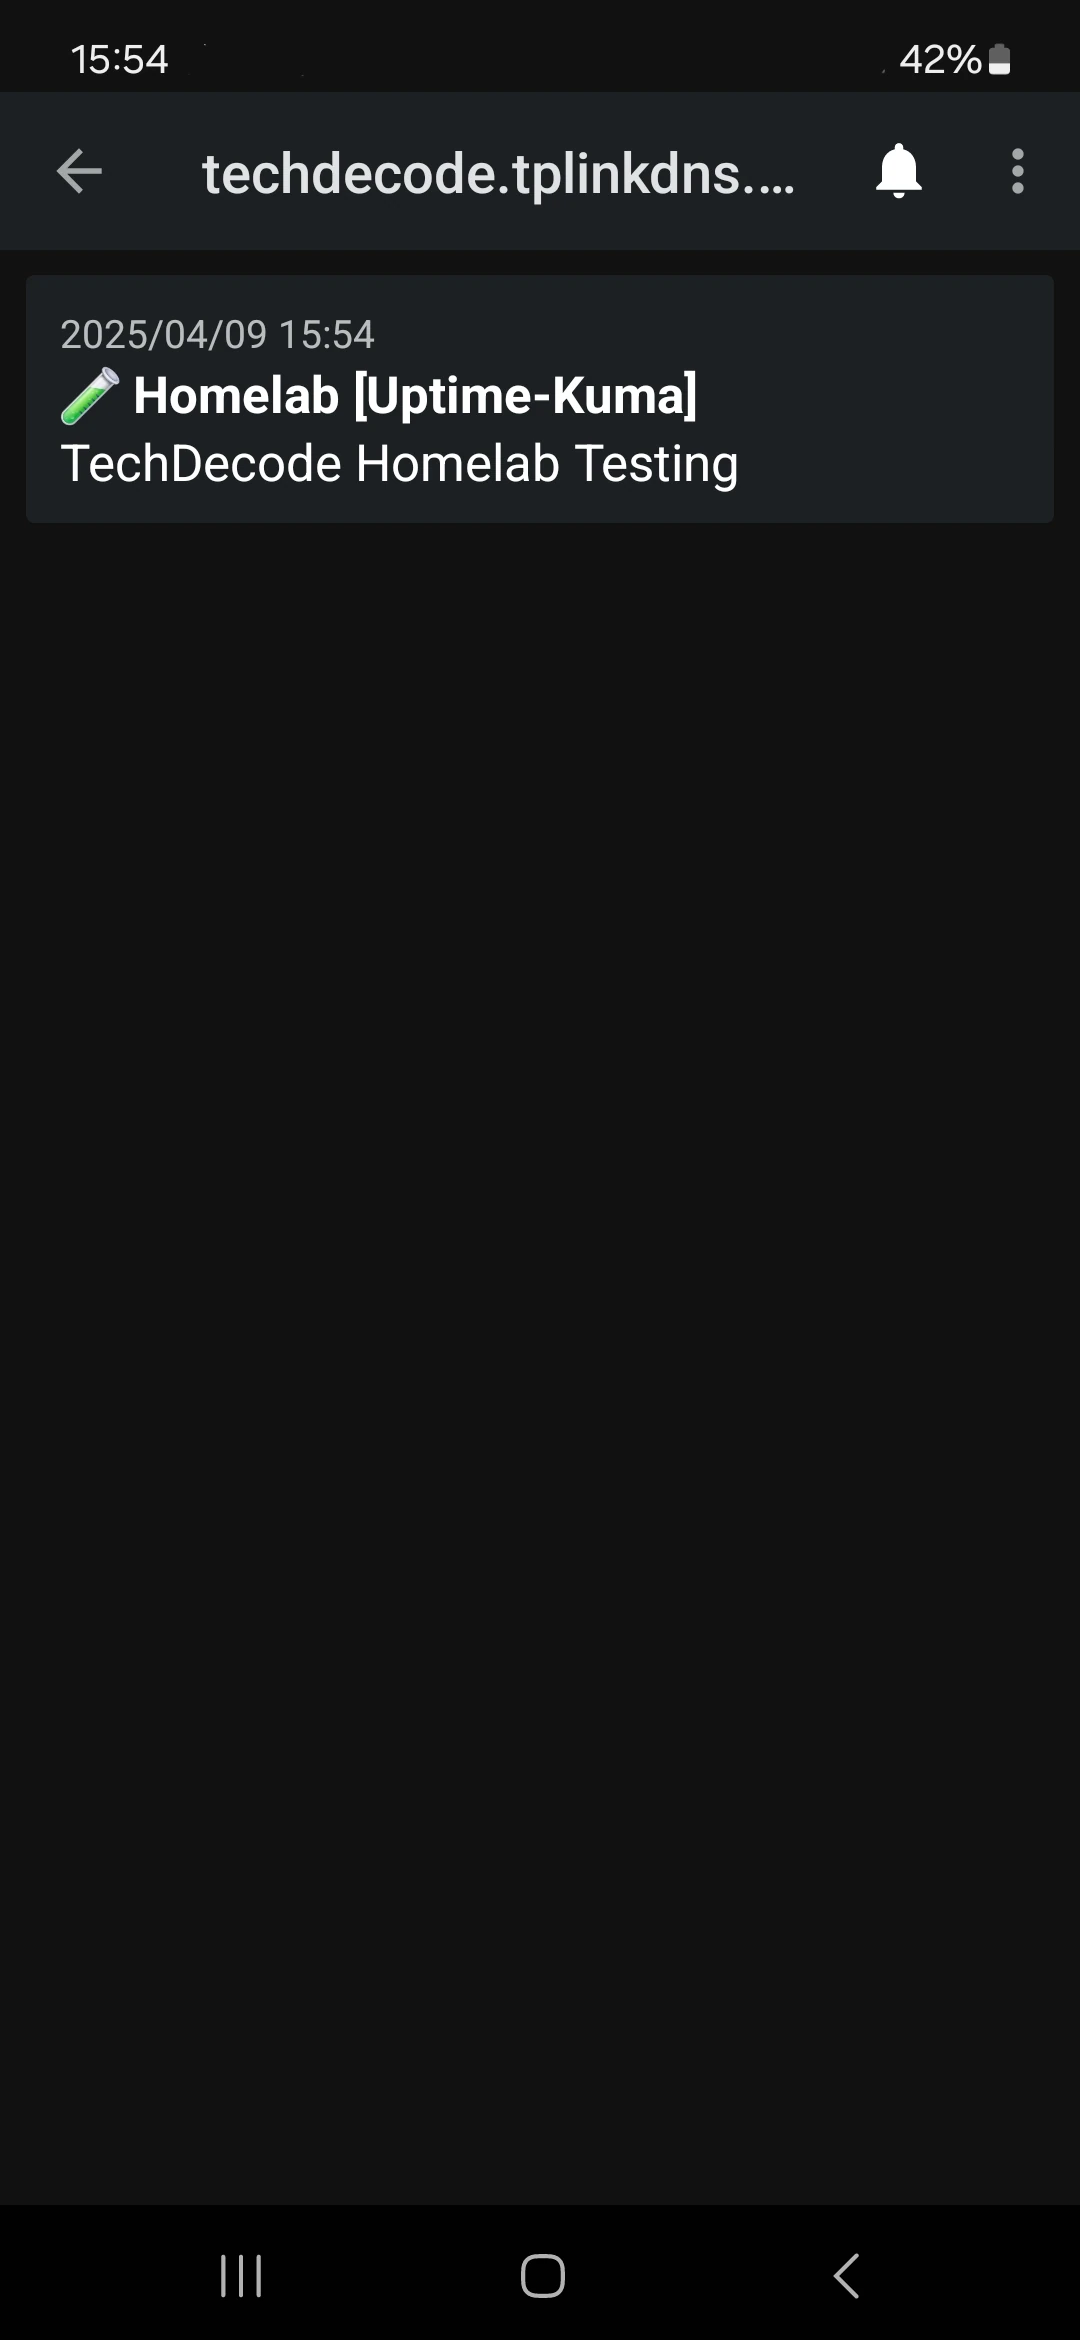
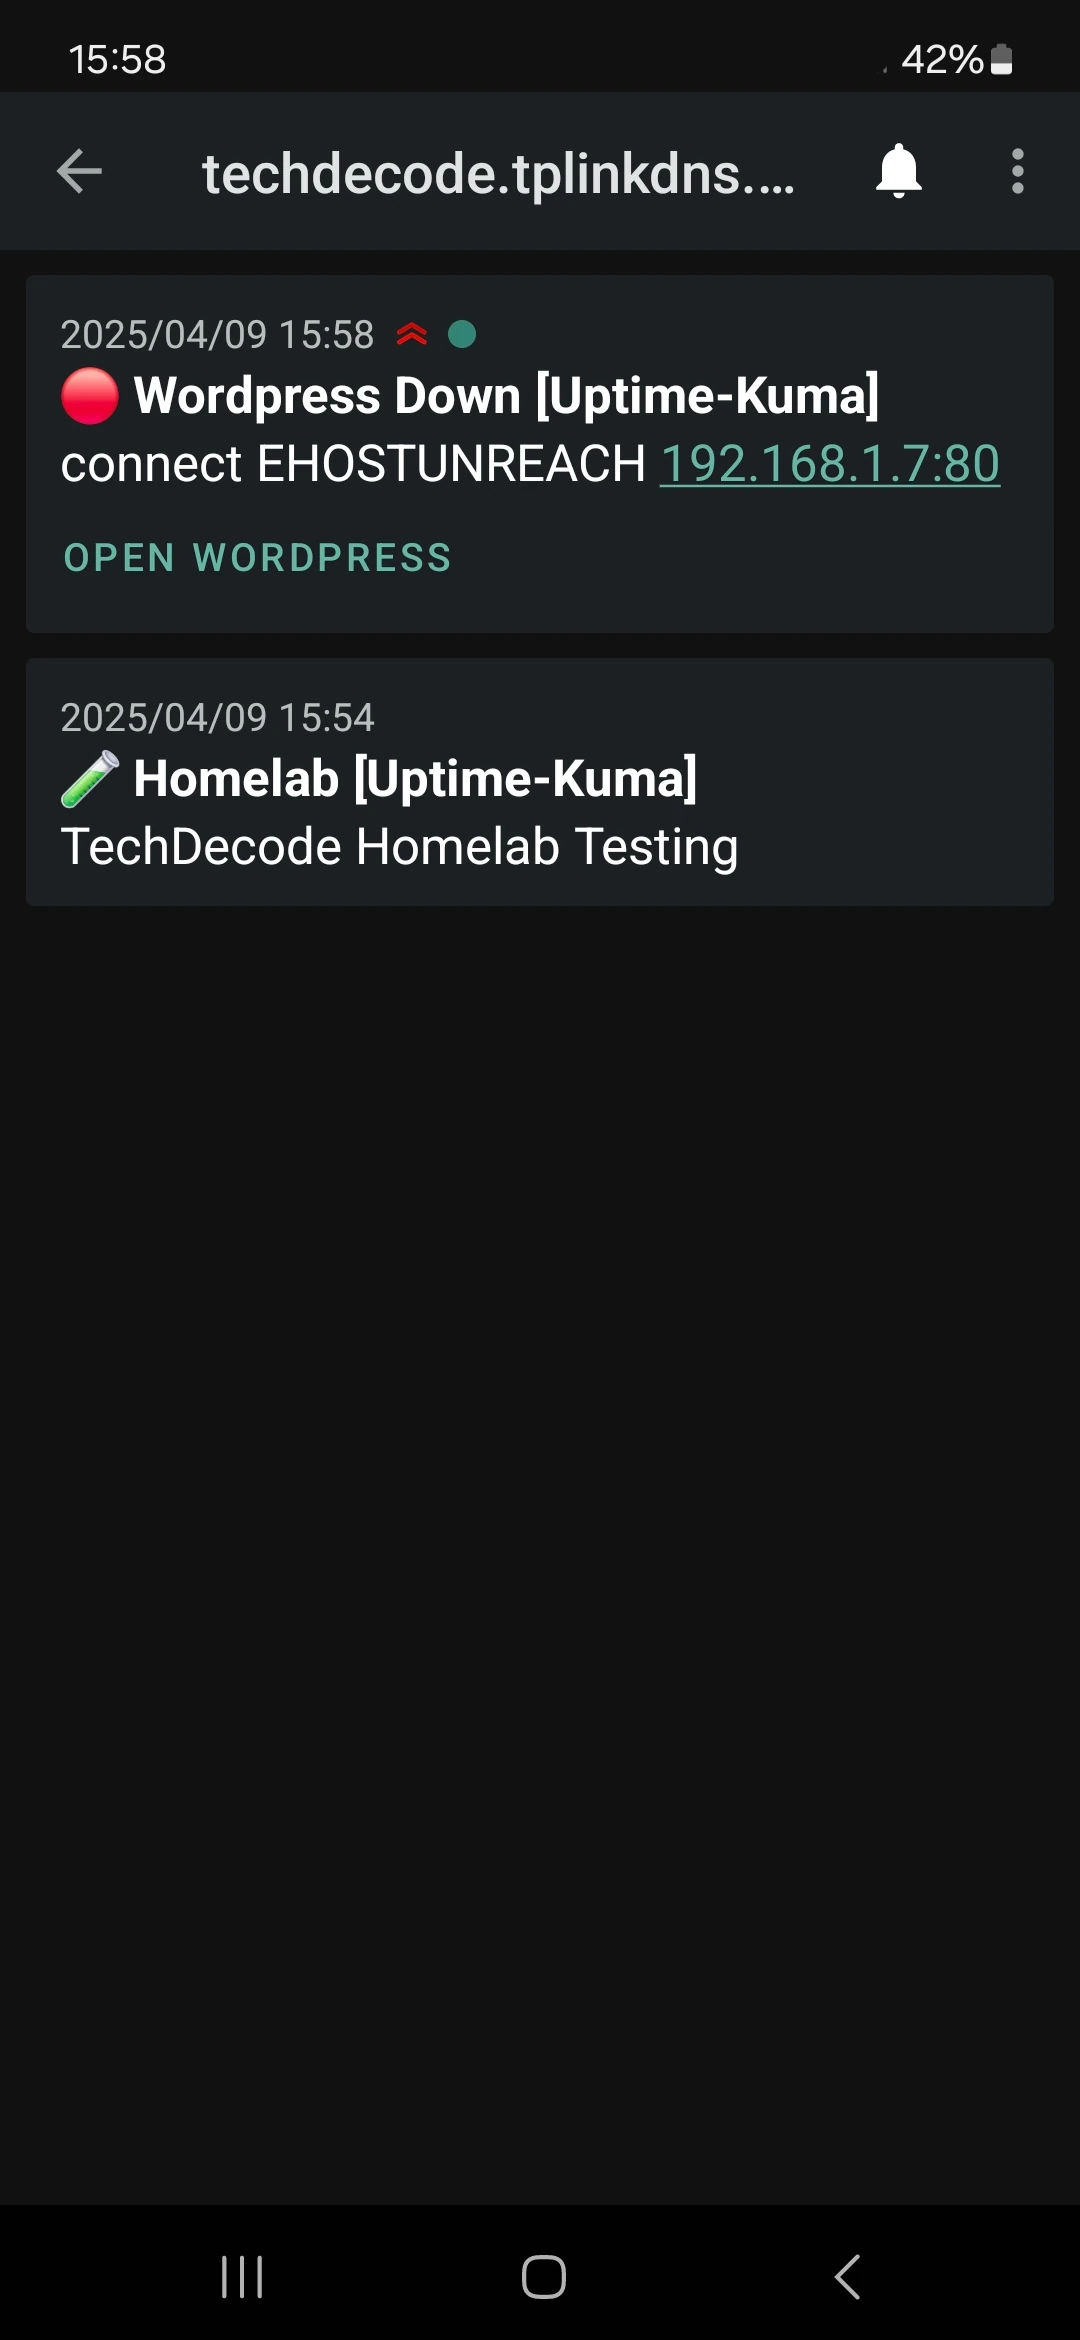
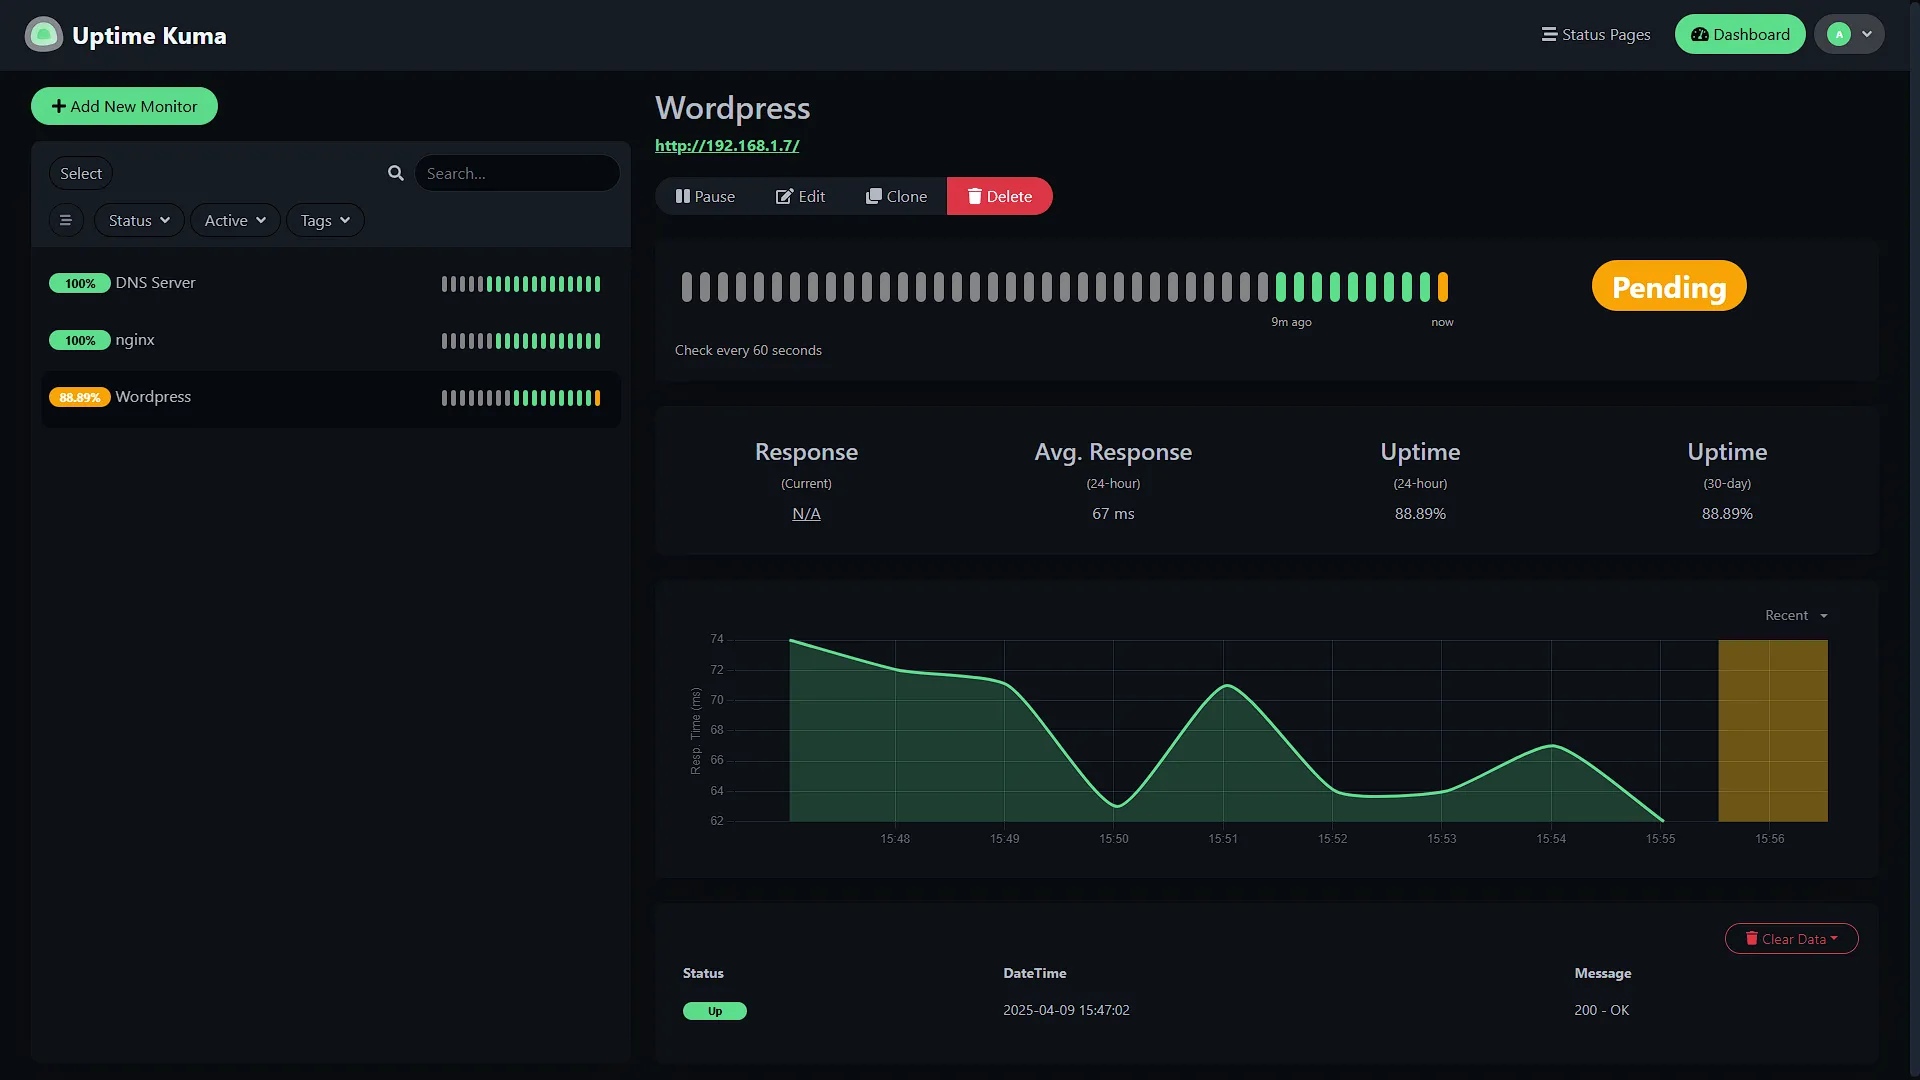
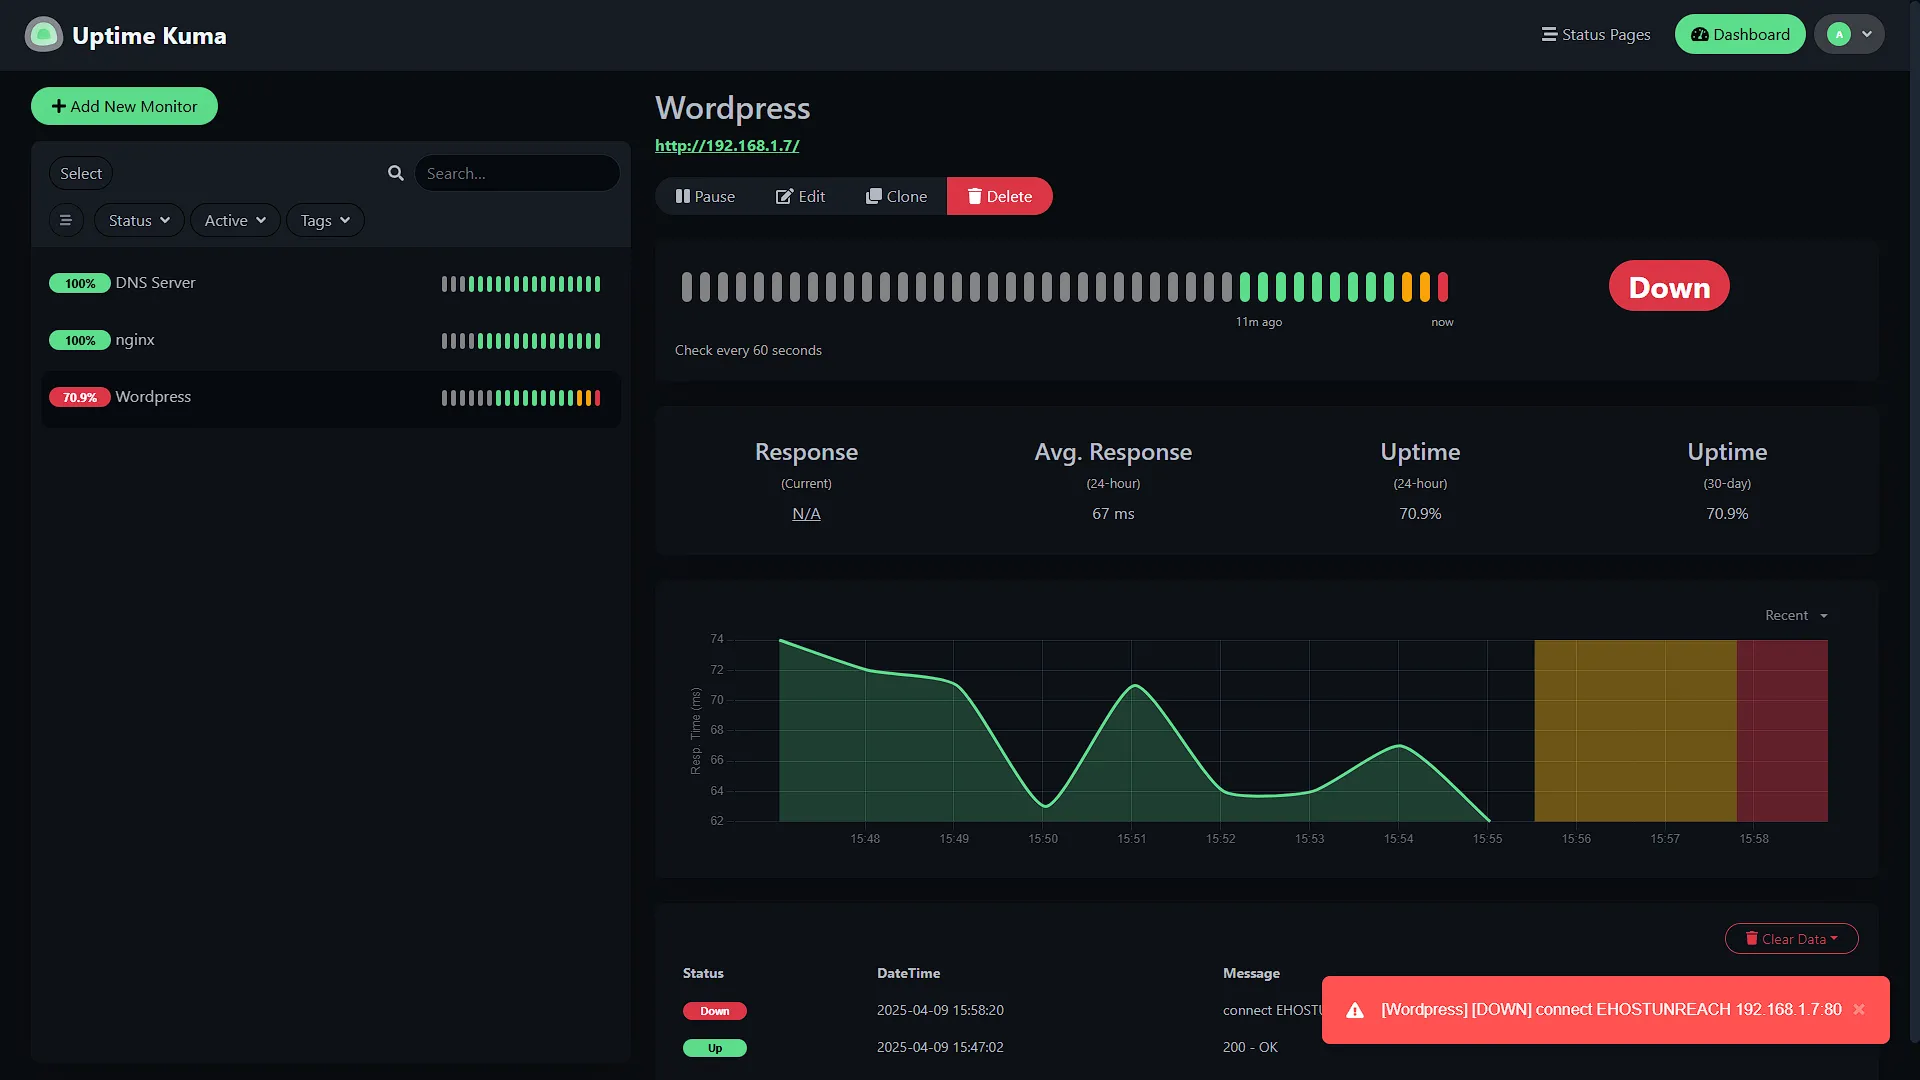
We can now test this properly by switching off a service we are monitoring. We are going to switch off Wordpress, so we are going to stop it in Proxmox. Once stopped, you will notice Uptime Kuma stating that it is pending. This is where the amount of retries comes in. We set it to two, meaning it will have two alert intervals of pending before going into the DOWN state. Once in the DOWN state, we will receive a notification from Uptime Kuma:
Optional After the Walkthrough: Choose a Check That Matches the Service
Keep the demonstrated Homelab topic, its account permissions and the phone subscription. Topic spelling is case-sensitive. First use Kuma's notification test, then trigger a controlled monitor failure and recovery. A successful test message proves the notification provider settings, but not that a real monitor transition sends to that provider.
| Question | Useful check | Limitation |
|---|---|---|
| Can the website answer? | HTTP/HTTPS against the configured URL. | A welcome page is not proof that login or uploads work. |
| Can the local resolver answer? | DNS query using the actual Technitium resolver address. | The web console on port 5380 tests administration, not DNS resolution. |
| Is a port reachable? | TCP check against the actual service port. | An open socket can still serve an unhealthy application. |
| Has an expected task reported? | Push/heartbeat check with a chosen timeout. | The sender must report real task success, not only script startup. |
Use the addresses actually installed in earlier parts; Technitium was demonstrated at 192.168.1.3. An invented .18 resolver or an undefined hostname makes a new test fail for reasons unrelated to the service. For a DNS test, choose a known record and verify the expected answer before enabling alerts.
HTTPS checks can also warn about certificate expiry when supported and enabled in your Kuma version. Set thresholds appropriate to your renewal process and test the notification path; do not assume every release uses the same preset days. Check the certificate for the hostname users actually visit, not only an internal IP.
Keep retries and intervals deliberate so a brief restart does not create a flood of messages. If a service is stopped for maintenance, use the available maintenance or pause mechanism. Confirm that a recovery notification reaches the same phone after service returns.
Further reading: Uptime Kuma project documentation.
Conclusion
We can now get notified of monitors from Uptime Kuma going down, so we can monitor our Homelab as we wish. We can set up all the services we want to monitor as a monitor in Uptime Kuma and push their DOWN notification to ntfy where we will receive a notification on our phones. We can also monitor other sites if we so wish, but for now we can keep a close eye on our self-hosted services.