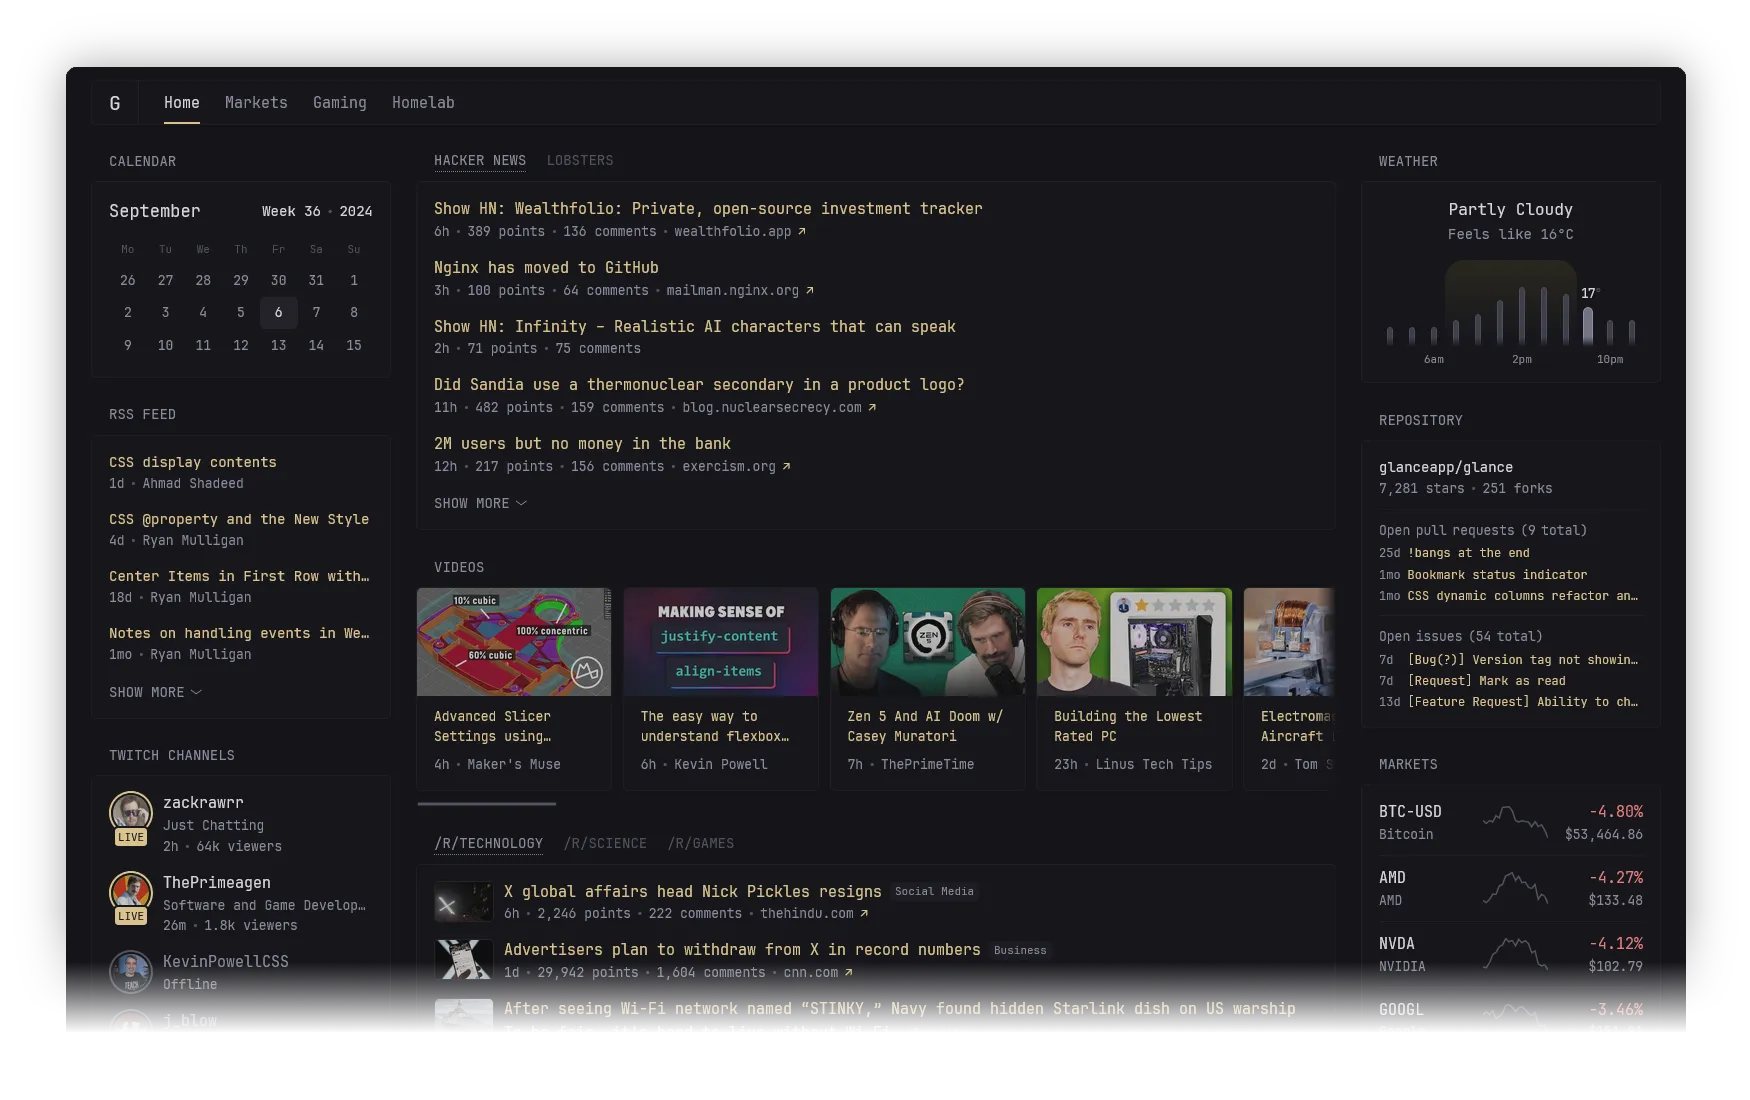
Glance brings useful links, feeds, release information and service checks onto a configurable dashboard. It can provide a convenient starting page for a homelab, including a Proxmox environment, without replacing the applications themselves. A well-chosen dashboard answers a few recurring questions quickly: where is a service, does its HTTP endpoint respond, and which relevant projects have released updates?
Choose What the Dashboard Should Show
Start with information you actually use. Put essential service bookmarks first, then add a small set of feeds or release widgets. Separate administrative links from family-facing links if the intended readers differ. A screen full of widgets can hide a failed service as easily as it can reveal one.
Glance's upstream repository describes a Go application with a YAML configuration. A compact executable does not establish a fixed memory footprint. Widget selection, cache data and refresh activity affect resource use; measure your own installation rather than comparing invented RAM numbers for unrelated dashboards.
Install a Small Reproducible Example
This example uses the v0.8.6 release. Use Docker Engine and Compose on a host you administer. In a dedicated directory, create config before starting the container, save the following as compose.yaml, and save the next block as config/glance.yml. The port is bound to host loopback for an initial private test.
services:
  glance:
    image: glanceapp/glance:v0.8.6
    restart: unless-stopped
    ports:
      - "127.0.0.1:8080:8080"
    volumes:
      - ./config:/app/config:ro
pages:
- name: Home
columns:
- size: small
widgets:
- type: bookmarks
groups:
- title: Project documentation
links:
- title: Glance
url: https://github.com/glanceapp/glance
- title: Proxmox
url: https://www.proxmox.com/
- size: full
widgets:
- type: releases
repositories:
- glanceapp/glance
- prometheus/prometheusmkdir -p config
docker compose config --quiet
docker compose pull
docker compose up -d
docker compose logs --tail=100 glanceThese commands assume authorized Docker access; use sudo where required by your host policy. If port 8080 is occupied, change the host-side port and your browser address together. Open http://127.0.0.1:8080 on the server, or use an authenticated SSH tunnel to that loopback endpoint from your computer. This binding does not automatically expose the dashboard to other LAN devices.
The starting configuration uses real project links and release repositories. Replace or extend them with your own service URLs after the basic page loads. It needs no unprovided .env file, Docker socket or graphics device. Keep the tested image version in your recovery notes, and read release changes before selecting a newer tag.
Add Widgets One at a Time
Use the version-matched configuration reference for widget fields. The monitor widget checks an HTTP endpoint from Glance's environment; its clickable URL must also make sense in your browser. A separate check-url can be useful when the server and browser reach the same service through different addresses.
For example, a Compose service name can resolve inside a shared Docker network while a desktop browser cannot resolve it. Conversely, a browser may reach a private hostname that the container's DNS cannot resolve. When a monitor fails, test the route used by Glance rather than relying only on a successful click from your laptop.
An HTTP status check shows what that endpoint returned. It is not proof that a backup completed, storage is healthy or a database query succeeds. Choose a meaningful health endpoint when the application provides one, and retain separate checks for important jobs. Do not treat an authentication denial as healthy merely to make a dashboard tile green.
Keep certificate verification enabled for HTTPS checks. If a private service uses a self-signed certificate, establish the appropriate trust or use a properly secured reachable endpoint. An allow-insecure setting is a conscious exception for a specific service, rather than a sensible default for every internal application.
Protect Access and Widget Credentials
This local demonstration has no application login configured. Before granting shared or remote access, configure Glance's native authentication or a properly authenticated proxy. Version 0.8.6 includes authentication-related fixes, so use its release notes and matching documentation rather than claiming the dashboard has no login capability.
Native authentication supports a generated secret and password hashes. Generate them using the documented secret:make and password:hash commands, then keep the resulting values in protected configuration. Avoid placing a real password directly in shell history. The documentation's environment and secret-file options can help keep widget credentials out of a public YAML repository.
A Docker socket grants powerful access to the engine. Mounting its socket path with a read-only filesystem flag does not turn engine API requests into read-only operations. The Docker daemon security guide explains why access must be protected. This recipe omits the socket; consider a carefully restricted integration only after reviewing what it can do.
Similarly, a local server-statistics widget inside a container is not a complete view of the Proxmox host by default. Decide which machine you intend to observe and follow the supported remote-agent or host-visibility setup for that version. Keep actual infrastructure monitoring separate from a convenient dashboard page.
Validate Desktop, Phone and Failure Behavior
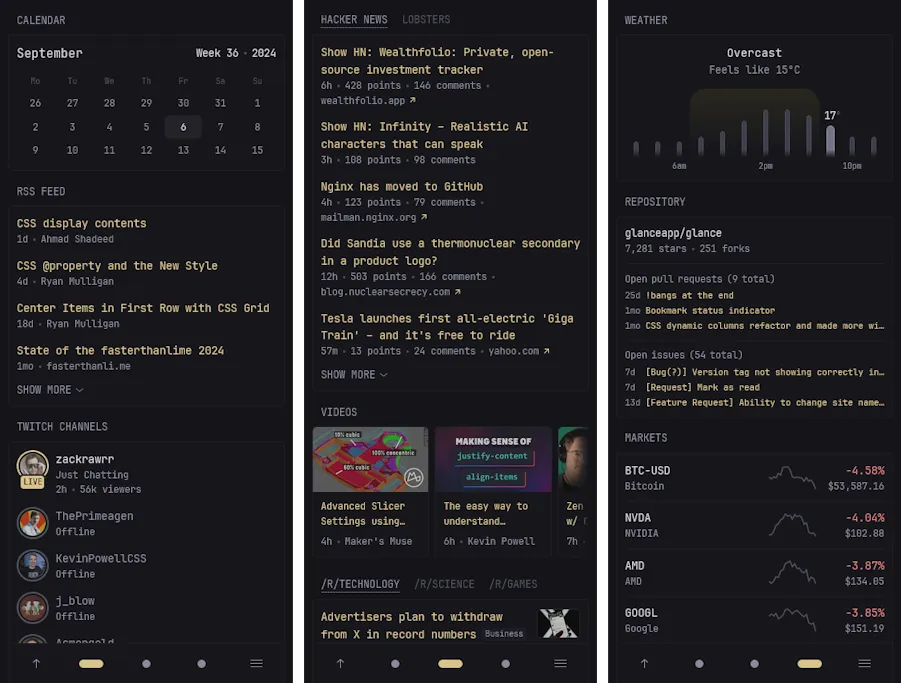
Glance is useful only if its layout works where you read it. Check your chosen widgets on a narrow phone screen as well as a desktop, and verify that long labels remain understandable. The retained mobile screenshot illustrates the original layout; your configuration can produce a different page.
- Open every important bookmark from the device that will use it.
- Confirm release widgets identify the intended repository, rather than a similarly named project.
- Add one monitor, test its success state, then use a disposable unreachable endpoint to understand the failure display.
- Restart Glance and confirm the mounted configuration still loads.
- Check that unauthorized users cannot access your protected dashboard after authentication is configured.
Maintain the Configuration and Recovery Path
Valid configuration-file changes can reload automatically. Environment-variable changes need a restart; invalid edits can leave the old configuration running while an error appears in logs. A browser still showing a page does not prove a saved edit was accepted. Read logs and check the specific widget you changed before moving on.
Back up the configuration, included files and local assets, while protecting any credentials. Keep a known working version in version control with secrets excluded. Recover by starting an isolated instance with that saved configuration and checking its links, widgets and authentication before replacing the working dashboard.
If widgets repeatedly fail, distinguish a configuration error from upstream rate limits, DNS or internet connectivity. Avoid frequent reloads while diagnosing an external API. Review the page periodically and remove obsolete widgets so it remains a maintained entry point. The Build Your Homelab series provides context for the services behind those links.