
Whether your homelab runs Home Assistant on your Raspberry Pi, Plex on an old machine or SmartOS, monitoring starts with collecting the right information. This article installs exporters for Windows and Linux hosts. The exporters expose measurements; the separate Prometheus server scrapes and stores them, and Grafana can display the stored results.
Distinguish the Exporter from Prometheus
node_exporter reports hardware and operating-system metrics on supported Unix-like systems. windows_exporter performs the corresponding Windows role. Their /metrics endpoints serve text measurements, not the Prometheus query interface. Installing an exporter alone does not give you historical graphs, an alert-delivery service or application-specific request metrics.
The official host-metrics guide shows this separation. Prometheus needs a target configuration to scrape the exporter. Applications may expose their own metrics or need an additional exporter. CPU and filesystem measurements cannot tell you whether a Plex playback request succeeds or a Home Assistant automation performs the intended action.
Install the Windows Exporter
Download the Correct Installer
Use the Windows Exporter GitHub Releases Page and choose the MSI for your supported Windows version and architecture. The project documentation currently lists Windows Server 2016 and later, and supported Windows 10/11 versions. Do not assume older Windows Server editions or an arbitrary installer architecture work.
Read the selected release's notes and retain its version. Run the MSI with administrator permission when needed to create the service. Begin with default collectors and port 9182 unless you have a specific reason to change them. Collector names and installer options can change, so use the documentation belonging to the version you install.
Follow the Installer and Check Its Configuration
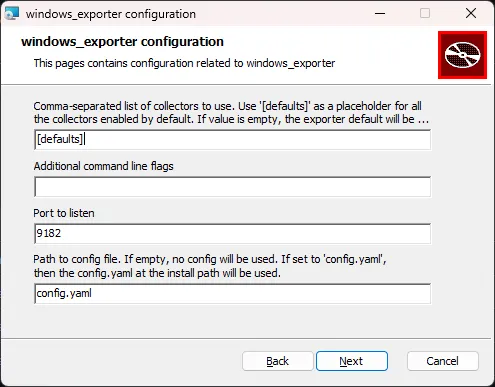
This is the original wizard screenshot. It shows default collectors, port 9182 and a config.yaml field. If supplying a configuration file, ensure that the specified file exists and uses the selected release's schema. For a first test without custom settings, use the installer's documented no-config-file option instead of pointing it at a nonexistent file. The screenshot records that earlier interface; a newer MSI can arrange options differently.
Inspect any firewall exception the installer creates. Permit scraping only from the intended monitoring host or network, rather than treating access to host metrics as harmless public access. Confirm the service is running and inspect the local endpoint using PowerShell:
Get-Service -Name windows_exporter
Invoke-WebRequest -Uri "http://127.0.0.1:9182/metrics"
Look for windows-prefixed host metrics as well as exporter runtime metrics. A response containing only generic runtime information does not establish that the collectors you need succeeded. If the service fails, check its executable arguments, configuration path, permissions and logs before reinstalling.
Install Node Exporter on Debian or Ubuntu
The following fresh-install example targets Linux amd64 with systemd. A Raspberry Pi requires the asset matching its operating-system architecture; board model alone does not tell you whether the installed OS is 32-bit or 64-bit. Use the Prometheus Node Exporter Downloads page to select the correct release and checksum.
This versioned example uses 1.12.1 and its published Linux-amd64 SHA256 checksum. Run it in a new working directory. Stop if checksum verification fails; do not install an unverified archive.
curl -fLO https://github.com/prometheus/node_exporter/releases/download/v1.12.1/node_exporter-1.12.1.linux-amd64.tar.gz
printf '%s  %s
' b51d8a76aa2a9156a55d501aca6276fae09e262259a5e4e831d2c2222f084e63 node_exporter-1.12.1.linux-amd64.tar.gz | sha256sum -c -
tar -xzf node_exporter-1.12.1.linux-amd64.tar.gz
sudo install -o root -g root -m 0755 node_exporter-1.12.1.linux-amd64/node_exporter /usr/local/bin/node_exporter
sudo useradd --system --user-group --no-create-home --shell /usr/sbin/nologin node_exporter
Create the account only if it does not already exist; otherwise inspect and reuse a suitable dedicated account. Keep the executable owned by root rather than writable by the service account. Save this unit as /etc/systemd/system/node_exporter.service:
[Unit]
Description=Prometheus Node Exporter
Wants=network-online.target
After=network-online.target

[Service]
User=node_exporter
Group=node_exporter
Type=simple
ExecStart=/usr/local/bin/node_exporter --web.listen-address=127.0.0.1:9100
Restart=on-failure

[Install]
WantedBy=multi-user.target
sudo systemctl daemon-reload
sudo systemctl enable --now node_exporter
sudo systemctl status node_exporter --no-pager
curl --fail http://127.0.0.1:9100/metricsThis begins with a local-only endpoint. For a central Prometheus server on another machine, change the listen address to an appropriate private interface and restrict access using the host/network policy. Verify the endpoint from that monitoring machine. Its localhost refers to itself, so it cannot scrape your remote exporter at 127.0.0.1.
Alternative: Monitor the Host Through Docker
Use this instead of the native service, rather than starting both on the same port. The node_exporter README requires host namespace and filesystem visibility when containerizing host monitoring. On Linux, the corresponding Compose example is:
services:
  node_exporter:
    image: quay.io/prometheus/node-exporter:v1.12.1
    network_mode: host
    pid: host
    command:
      - --path.rootfs=/host
      - --web.listen-address=127.0.0.1:9100
    volumes:
      - /:/host:ro,rslave
    restart: unless-stopped
There is no port mapping with host networking. Review the broad host visibility this grants and mount any additional filesystems that your monitoring needs. Docker Desktop's Linux VM is a different environment from a native Linux host. Check reported host identity and filesystem sizes against the intended machine so a working endpoint does not silently monitor the wrong environment.
Connect Prometheus and Validate Scrapes
For Prometheus running natively on the same host as the Linux exporter, add a job like this to its existing scrape_configs list. Do not overwrite the rest of the server configuration. A remote host requires its reachable private address instead.
- job_name: linux-host
  static_configs:
    - targets: ["127.0.0.1:9100"]
Validate and reload Prometheus using its supported procedure, then check the target's state and scrape error. The query up{job="linux-host"} should report successful scrapes. That result describes exporter reachability and scrape success, not the health of every service on the machine.
Confirm a needed host metric such as node_filesystem_avail_bytes exists, inspect labels to identify the correct mount, and compare its value with the host's filesystem tools. Cumulative counters need a rate or increase over a time window when you want activity per second; a growing byte counter is not directly a current bandwidth reading.
Protect and Maintain the Monitoring Path
Exporter metrics can disclose hostnames, mounts and other infrastructure details. Restrict exposure and consult supported TLS/authentication options where needed. The Prometheus security configuration supports TLS and basic authentication; the old blanket claim that Prometheus has neither is incorrect.
Retention belongs to the Prometheus server, not these exporters. Longer history needs suitable storage and configured retention; remote storage is one option, not the only way to exceed a default period. Alert delivery and application probes need separate configuration and tests.
Record exporter versions, service settings and the target address. After a host reboot or update, verify service startup, target state and representative metrics. Test the failure path during a controlled stop so you understand how missing data appears. A dashboard is dependable only when collection continues after the installation session ends.