The world of server monitoring is vast, with established giants like Prometheus and Grafana dominating the landscape. We even have an entire series on the Prometheus/Grafana combination, and we have explored using Prometheus with Grafana in our homelab as well as part of the Build your own homelab series. They offer powerful, flexible, and highly configurable solutions. But what if your needs are simpler? What if the complexity and resource footprint of these tools are overkill for your setup? Enter Beszel (beszel.dev), a relatively new player aiming to provide a straightforward, lightweight server monitoring experience.
Is Beszel a true Prometheus/Grafana replacement? Let's dive in and explore what it offers.
What is Beszel and How Does It Work?
Beszel is an open-source, lightweight server monitoring platform designed with simplicity and ease of use at its core. It provides insights into your server's performance, Docker/Podman container statistics, historical data, and alerting functionalities through a clean web interface.
The architecture of Beszel is straightforward, consisting of two main components:
- The Beszel Hub: This is the central web application, built on PocketBase. It acts as the dashboard where you can view and manage all your connected systems, analyze historical data, and configure alerts.
- The Beszel Agent: This lightweight agent runs on each server or system you want to monitor. It collects system metrics and communicates them securely to the Hub. The hub can connect to the agent’s dedicated SSH server, or the agent can initiate a WebSocket connection to the hub. The direction matters when hosts are behind NAT or cannot accept an inbound connection.
This hub-and-agent model allows for centralized monitoring of distributed systems with minimal overhead on the monitored machines.
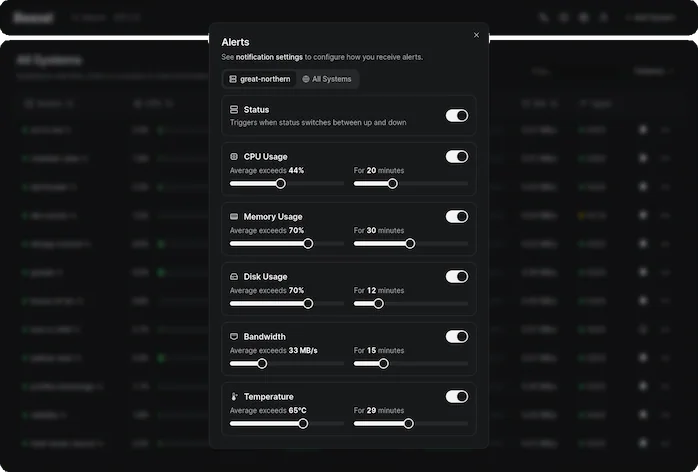
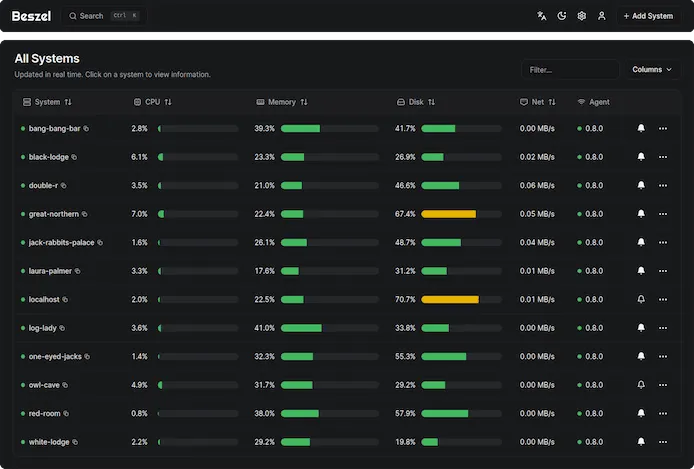
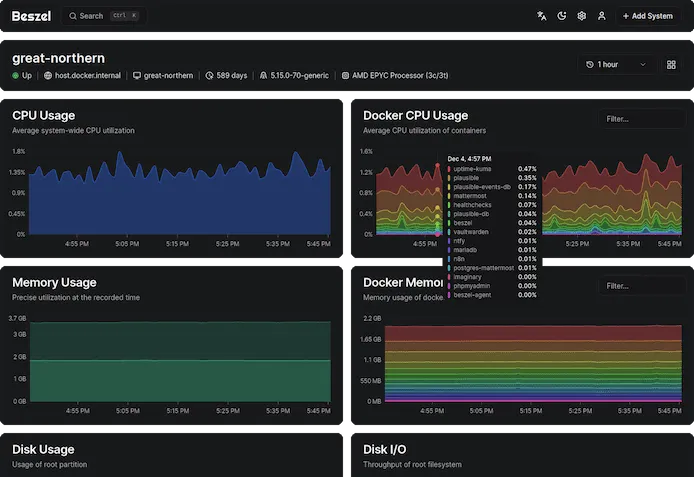
The gallery illustrates the May 2025 interface; the dashboard lists agent version 0.8.0. The Add System screenshot below uses a local Unix socket. Current releases may expose different options, so use the configuration generated by your installed hub.
Beszel's Key Features
Beszel packs a decent set of features, especially considering its focus on being lightweight:
- Lightweight & Simple: This is Beszel's main selling point. It's designed to be less resource-intensive and easier to set up and manage compared to more complex solutions. No need for public internet exposure for basic operation.
- Server Monitoring: Tracks essential server metrics like CPU usage, memory usage (including swap and ZFS ARC), disk usage (multiple partitions/devices), disk I/O, network usage, and system temperature.
- Docker/Podman Container Stats: A significant plus for those running containerized applications. Beszel tracks CPU, memory, and network usage history for each container.
- GPU Monitoring: Supports GPU metrics with platform-specific collectors. Current documentation includes NVIDIA, AMD and Intel options, including suitable Docker images and device access; it is not limited to binary agents. Available metrics depend on the GPU, driver and collector.
- Configurable Alerts: Set up alerts for various thresholds related to CPU, memory, disk space, bandwidth, temperature, and overall system status. Notifications can be configured (e.g., email, with SMTP server setup).
- Historical Data: Stores and presents historical data, allowing you to track performance trends over time.
- User-Friendly Web Interface: Provides a clean and intuitive dashboard for visualizing metrics and managing monitored systems.
- Multi-User Support: Allows multiple users to manage their own systems. Administrators can also share systems across different users.
- Authentication: Supports OAuth/OIDC for secure login, and password authentication can be disabled if desired.
- Automatic Backups: Supports backups to disk or S3-compatible storage. Configure the schedule and destination and test restoration; an untouched default or a copy on the same failed host does not establish a recovery plan.
- REST API: Offers a REST API, enabling you to integrate Beszel data with your own scripts, applications, or other tools.
Beszel vs. Prometheus and Grafana: The Core Differences
While Beszel offers monitoring capabilities, it's crucial to understand how it differs from the Prometheus and Grafana stack:
| Feature | Beszel | Prometheus | Grafana |
|---|---|---|---|
| Primary Goal | Simple, lightweight server & Docker monitoring with basic visualization | Robust time-series data collection, storage, and powerful querying (PromQL) | Rich data visualization, dashboarding, and exploration from various sources |
| Complexity | Low; easy setup and management | Moderate to High; requires understanding of its components and PromQL | Moderate; configuration depends on data sources |
| Resource Usage | Designed for a small monitoring footprint; measure your workload | Depends on targets, series, retention and queries | Depends on dashboards, queries and connected data sources |
| Data Collection | Hub-initiated SSH or agent-initiated WebSocket | Primarily pull-based (scrapes metrics from HTTP endpoints); supports push gateway | Relies on data sources like Prometheus, InfluxDB, Elasticsearch, etc. |
| Querying | Basic filtering and data exploration via UI | Powerful and flexible PromQL (Prometheus Query Language) | Utilizes the query languages of its connected data sources |
| Visualization | Integrated, clean, but less customizable | Basic built-in expression browser; can also be visualized using Grafana | Highly customizable and versatile dashboards with numerous panel types |
| Alerting | Built-in, configurable basic alerts | Powerful Alertmanager component with advanced routing and grouping | Can integrate alerts from data sources or define its own (depending on version) |
| Ecosystem | Smaller, focused | Large, mature ecosystem with many integrations and exporters | Extremely broad, supports a vast array of data sources and plugins |
| Scalability | Suited for small to medium setups | Can scale to very large environments (may require federation, sharding) | Scales well for visualization; performance depends on data source queries |
In essence:
- Prometheus is the powerhouse for metrics collection and alerting, offering deep insights with PromQL.
- Grafana is the master of visualization, capable of creating stunning and informative dashboards from supported data sources through its integrations.
- Beszel aims to provide a much simpler, all-in-one solution for essential server and container monitoring with less of a learning curve and resource demand.
Where Does Each Shine? Use Cases
Choose Beszel if:
- You need a simple, quick-to-set-up monitoring solution for personal servers, homelabs, or small to medium-sized applications.
- Your primary focus is on basic server health (CPU, memory, disk, network) and Docker/Podman container stats.
- You prefer an all-in-one solution with integrated data collection, storage, basic visualization, and alerting without juggling multiple tools.
- You have limited resources (CPU, memory) on the systems you want to monitor or the monitoring host itself.
- The learning curve for Prometheus/Grafana seems daunting for your current needs.
- You appreciate features like multi-user support and OAuth out-of-the-box for a small team.
Stick with or Choose Prometheus/Grafana if:
- You need highly detailed metrics from a wide array of applications, services, and infrastructure (e.g., Kubernetes, databases, message queues).
- Advanced querying and analysis with PromQL are essential for your operational insights.
- You require highly customizable and sophisticated dashboards with complex visualizations and data correlations.
- You need a robust, scalable alerting system with complex routing, silencing, and notification integrations (Prometheus's Alertmanager).
- You're dealing with large-scale, complex microservice architectures or cloud-native environments.
- You need to integrate with a broad ecosystem of exporters and other observability tools.
- Long-term data retention and analysis with powerful downsampling and aggregation are critical.
Prometheus and Grafana are often used together because their strengths are complementary. Beszel, on the other hand, offers a more integrated but less functionally deep experience.
Getting Started: Installing Beszel
Beszel offers flexibility in installing both its Hub and Agent components.
Beszel Hub Installation:
The Hub can be installed via the following methods. The container example exposes the UI on port 8090: restrict access with your firewall or reverse proxy, create the first admin account on a trusted connection, and set APP_URL to the address you actually use when required by your deployment.
- Docker/Podman: This is often the easiest way. Beszel provides
docker-compose.ymlexamples.
services:
  beszel:
    image: henrygd/beszel:latest
    container_name: beszel
    restart: unless-stopped
    ports:
      - "8090:8090"
    volumes:
- ./beszel_data:/beszel_data- Single Binary:
- Linux Install Script: The Linux installer script downloads a binary and can set up a systemd service. Review the fetched script and the changes it will make before running it with the permissions it requires:
curl -fsSL https://get.beszel.dev/hub -o /tmp/install-hub.sh &&
  less /tmp/install-hub.sh
Read the complete script in the pager or an editor. After reviewing it and deciding to proceed, run this separate step:
chmod +x /tmp/install-hub.sh &&
/tmp/install-hub.sh- Manual methods
- Manual Download: Download the prebuilt binary for your server's architecture from the GitHub releases.
- Manual Compile: Compile from source if a prebuilt binary isn't available or if you prefer.
Beszel Agent Installation:
The Agent offers several installation options. Check the chosen OS and architecture and how it will reach the hub; installer-script instructions are for Linux.
- Using the Hub UI: The recommended way to start. When adding a new system in the Beszel Hub web UI, it provides copy-paste commands (Docker Compose or binary install commands) tailored for that system.
- When the hub has been installed, click on Add System and you will get a screen that will explain how to get the agent installed either via Docker or via binary download.
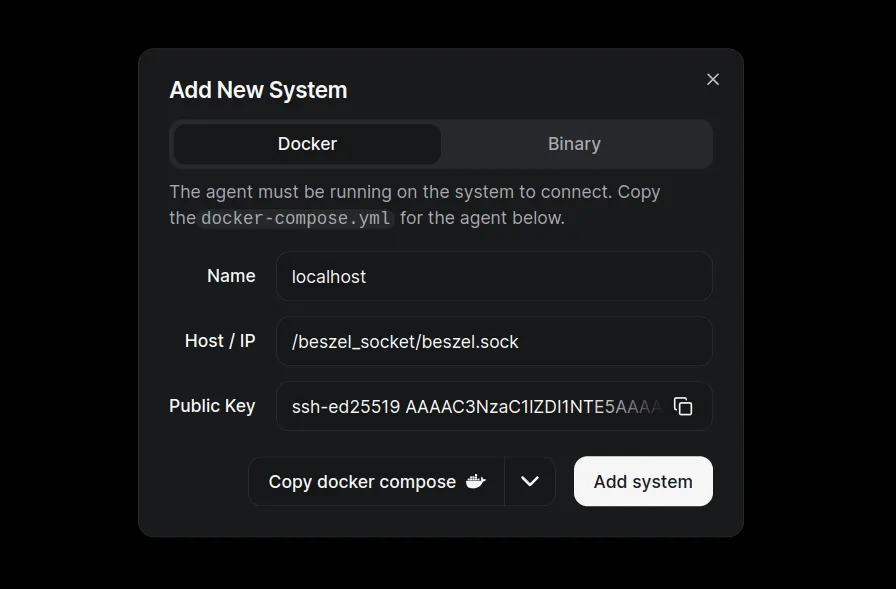
- Docker/Podman: Similar to the hub, you can run the agent as a container. The Hub UI provides the necessary
docker-compose.ymlsnippets. - Single Binary:
- Linux Install Script: The official script installs the agent and can set up a service. It may require root privileges to create a user and service. First download it and inspect the complete script:
curl -fsSL https://get.beszel.dev -o /tmp/install-agent.sh &&
  less /tmp/install-agent.sh
After reviewing it and deciding to proceed, execute it in a separate step:
chmod +x /tmp/install-agent.sh && /tmp/install-agent.sh - Manual Download: Download the binary for your OS/architecture.
- Manual Compile: Compile from source.
- Linux Install Script: The official script installs the agent and can set up a service. It may require root privileges to create a user and service. First download it and inspect the complete script:
- Package Managers:
- Homebrew (macOS)
- Scoop (Windows)
- Winget (Windows)
- Home Assistant integration: A third-party agent option; check its own supported Home Assistant installation method and maintenance.
Always refer to the official Beszel documentation for the most up-to-date and detailed installation instructions.
Limitations and Things to Keep in Mind
While Beszel offers simplicity, this comes with certain trade-offs compared to more comprehensive solutions:
- Less Advanced Querying: Beszel does not feature a powerful query language like PromQL. Data exploration and analysis capabilities are more basic and UI-driven.
- Simpler Alerting: While it has alerts, they might not be as flexible or feature-rich as Prometheus's Alertmanager in terms of routing, grouping, inhibition rules, or integration with diverse notification channels.
- Visualization Customization: The built-in dashboards are clean but offer less customization than Grafana's extensive panel options and configurations.
- Scalability for Very Large Deployments: Beszel is designed to be lightweight and is likely best suited for small to medium-sized environments. For extremely large numbers of targets or very high metrics cardinality, a more robust solution like Prometheus might be necessary.
- Community and Ecosystem: Being a newer project, its community and the ecosystem of pre-built integrations (like exporters for various third-party software) will be smaller than that of Prometheus and Grafana.
- Depth of Metrics: While it covers common metrics and Docker stats, specialized monitoring for specific applications (e.g., detailed JVM metrics, specific database performance counters) might require more specialized collectors or exporters typically found in the Prometheus ecosystem.
- Data Retention and Storage: While it has backup options, advanced configurations for long-term storage, data tiering, or integration with various time-series databases might be more limited compared to Prometheus, which can be paired with solutions like Thanos or VictoriaMetrics for long-term storage.
It's important to evaluate these points against your specific requirements. If your needs align with Beszel's core strengths, these limitations may not be significant drawbacks.
Conclusion: Is Beszel Your Next Monitoring Tool?
Beszel carves out a niche for users who find the Prometheus/Grafana stack overly complex or resource-heavy for their needs. It's not a direct one-to-one replacement for the full power and flexibility of Prometheus combined with Grafana, especially in large-scale or highly specialized environments.
However, Beszel is an excellent choice if you're looking for:
- Simplicity and Ease of Use: Get up and running quickly with minimal configuration.
- Lightweight Footprint: Ideal for resource-constrained environments or smaller setups.
- Core Server and Docker/Podman Monitoring: If these are your primary concerns, Beszel provides a focused solution.
- An All-in-One Package: Data collection, storage, basic visualization, and alerting in a single tool.
- A User-Friendly Interface: Manage and view your systems without a steep learning curve.
For homelab enthusiasts, small development teams, or anyone needing straightforward server monitoring without the operational overhead of more complex systems, Beszel presents a compelling and refreshing alternative. It successfully lowers the barrier to entry for effective server monitoring, making it accessible to a broader audience. Give it a try at beszel.dev!
An Agent Example With Extra Filesystems
Start with the agent configuration generated by Add System. For an SSH agent on a trusted Linux network, the following illustrates the container layout. Replace REPLACE_WITH_HUB_PUBLIC_KEY with the complete public key from the hub before starting. Use the actual host/IP and port when registering this remote agent; do not copy the Unix socket address from the screenshot for a different machine.
services:
  beszel-agent:
    image: henrygd/beszel-agent:latest
    container_name: beszel-agent
    restart: unless-stopped
    network_mode: host
    volumes:
      - /var/run/docker.sock:/var/run/docker.sock:ro
      - ./beszel_agent_data:/var/lib/beszel-agent
      # Optional: create this directory on the intended mounted filesystem first.
      - /mnt/media/.beszel:/extra-filesystems/media:ro
    environment:
      LISTEN: "45876"
      KEY: "REPLACE_WITH_HUB_PUBLIC_KEY"
Remove the optional media mount if it does not apply. A small directory on the filesystem is enough to expose its usage; mounting an entire media library is unnecessary. Host networking lets the container observe host interfaces, but metrics still depend on platform access and configuration. The Docker socket grants powerful access to the daemon even when the bind mount is marked :ro; include it only when container statistics are needed and the agent is trusted.
The additional-disk guide distinguishes usage from I/O: network-mounted drives do not provide the same local disk I/O statistics, and encrypted or mapped devices can need an explicit kernel-device association. A mounted path also does not automatically enable S.M.A.R.T. monitoring. That needs supported tools, device access and permissions from the separate S.M.A.R.T. guide. Do not interpret an absent metric as a healthy disk.
Connections, Alerts and Recovery
For SSH, the hub initiates the connection and the agent accepts the hub’s key. The current security guide says the hub does not verify the agent’s SSH host key, so use a trusted network path. This is not a general shell service and should not be treated as one.
For agents across an untrusted network, Beszel recommends its WebSocket mode with an HTTPS hub URL. Use the generated key, registration token and URL, and preserve agent data containing its registration identity. A plain http:// hub URL is not a guarantee of encrypted WebSocket transport. NAT traversal works when the agent can reach the hub; it does not make an unreachable hub accessible automatically.
Keep the hub UI behind appropriate authentication and access controls. If you configure OAuth/OIDC, verify login and recovery before disabling password authentication, and choose user creation and system sharing deliberately. Monitoring data can expose hostnames, container names and activity even when it contains no application payloads.
Start alerts with an actual baseline. A short CPU burst during a scheduled backup may be normal, while a filesystem approaching capacity or a disconnected host may deserve prompt action. Set a duration as well as a threshold where supported, test the notification channel and document what you will do when an alert arrives. Do not assume low CPU proves the application responds correctly; use an appropriate service health check as well.
Retain a recoverable hub backup, deployment configuration and protected credentials outside the monitored machine. Restore to an isolated instance and verify that history, users and systems are present. Check agent reconnects and alert delivery after an upgrade. These are suggested validation steps, not measurements or a deployment test performed for this article.